
Amazon Inventory Forecasting: Reorder Points, Safety Stock, and Avoiding Stockouts in 2026
Inventory forecasting is where Amazon sellers quietly win or lose their margin. Run out of stock and you surrender your Best Seller Rank, restart the ranking honeymoon, and hand sales to competitors. Overstock and you bleed cash into monthly storage fees, aged-inventory surcharges, and capital you can't reinvest. The discipline that separates profitable sellers is simple to state and hard to execute: order the right quantity, at the right time, backing out from your true replenishment lead time. This guide covers demand forecasting, reorder points, safety stock, FBA capacity and IPI limits, and seasonal planning — the mechanics of keeping inventory in stock without drowning in it. SellerForge's Forecasting module models per-SKU velocity, lead times, and seasonality so reorder timing stops being a spreadsheet guess. But whether you use software or a spreadsheet, the underlying math is the same, and understanding it is what lets you trust — or override — any tool's recommendation. Get forecasting right and every other lever, from PPC to pricing, works better.
How Do You Forecast Demand for an Amazon Product?
Start with your trailing sales velocity — units sold per day over a recent window — then adjust for trend, seasonality, and known events like promotions or Prime Day. Use several windows (7, 30, and 90 days) rather than a single average, because one blended number hides both momentum and volatility that change your reorder math.
The reason multiple windows matter is that they tell different stories. A 7-day velocity of 25 units/day against a 90-day velocity of 15 units/day signals a product that's accelerating — reorder against the higher, more recent number or you'll under-buy. The reverse pattern signals a fade you shouldn't chase with a big purchase order. Forecasting at the individual SKU level is critical: a parent ASIN with five variations can be growing overall while two child SKUs are quietly dying, and an ASIN-level average will over-order the losers and starve the winners.
New products are the hardest to forecast because you have no velocity history. For a launch, anchor to a conservative estimate from comparable ASINs and category benchmarks, plan a smaller first order, and re-forecast aggressively once you have 2–4 weeks of real sell-through. Over-committing on a first order is the most common way new sellers end up paying long-term storage on inventory that never moved.
- Trailing velocity across multiple windows (7 / 30 / 90 days), measured per SKU, not per parent ASIN
- Trend direction — is recent velocity above or below the longer average?
- Seasonality index for the category and the calendar month
- Known demand events: promotions, Prime Day, coupons, Q4, price changes
- FBA vs. FBM split, since only FBA units count against Amazon capacity and storage
- Current on-hand plus already-inbound units, so you forecast the gap, not the total
How Do You Calculate Your Reorder Point and Reorder Quantity?
Your reorder point is the inventory level that triggers a new purchase order: multiply your average daily sales by your total replenishment lead time in days, then add safety stock. When on-hand plus already-inbound units fall to that number, you order. Wait any longer and you'll stock out before the next shipment clears Amazon receiving.
The number that trips up most sellers is total replenishment lead time — the full clock from placing a PO to units being sellable at Amazon, not just the factory's production time. For an overseas private-label seller, that's manufacturing, ocean freight, port and customs, plus Amazon's own receiving and check-in. It routinely runs 90–150 days. If you sell 20 units/day on a 100-day lead time, you have roughly 2,000 units committed to the pipeline before safety stock — reorder when the pipeline can no longer cover that.
Reorder quantity is a separate decision from reorder timing. Size each order to a target coverage window — commonly 60–120 days of forecasted sell-through — balanced against supplier minimum order quantities, per-unit price breaks at higher volumes, your working capital, and FBA storage economics. Ordering a full year of stock to hit a price break often destroys the savings in storage fees and tied-up cash. Ordering too little means paying freight and reorder overhead more often than necessary.
- Reorder Point = (average daily sales × total lead-time days) + safety stock
- Total lead time = manufacturing + freight + customs/port + Amazon receiving & check-in (3–14 days)
- Trigger the order against on-hand PLUS inbound/in-transit units, not on-hand alone
- Reorder quantity target = 60–120 days of forecasted sales, capped by working capital and storage cost
- Respect supplier MOQs and volume price breaks — but don't let them push you into overstock
How Much Safety Stock Should You Carry?
Safety stock is the buffer that covers demand spikes and lead-time delays between reorder and arrival. Size it to your variability, not a flat number: volatile sellers and unreliable suppliers need more; steady products with dependable freight need less. A common baseline is enough to cover the gap between your average and worst-case lead time at your normal sell rate.
Two kinds of uncertainty drive safety stock, and both compound during peak season. Demand uncertainty is sales running hotter than forecast — a competitor stocks out, a coupon overperforms, a listing gets featured. Lead-time uncertainty is supply arriving later than promised — a factory delay, a freight backlog, or Amazon receiving slowing down in Q4. Sellers who set safety stock only for demand variability get burned when the supply side slips, which is exactly when they can least afford a stockout.
The catch is that safety stock isn't free. Every buffer unit sits in FBA accruing monthly storage fees and, if it lingers, aged-inventory surcharges. This is the core tension of Amazon inventory planning: too little buffer risks stockouts and the low-inventory-level fee, too much buffer burns margin on storage. The right answer is variability-weighted, not a blanket '30 days for everything' — carry a fatter buffer on your erratic, high-margin winners and trim it on steady, low-margin SKUs where a brief stockout costs little.
How Do FBA Capacity Limits, IPI, and Restock Limits Affect Planning?
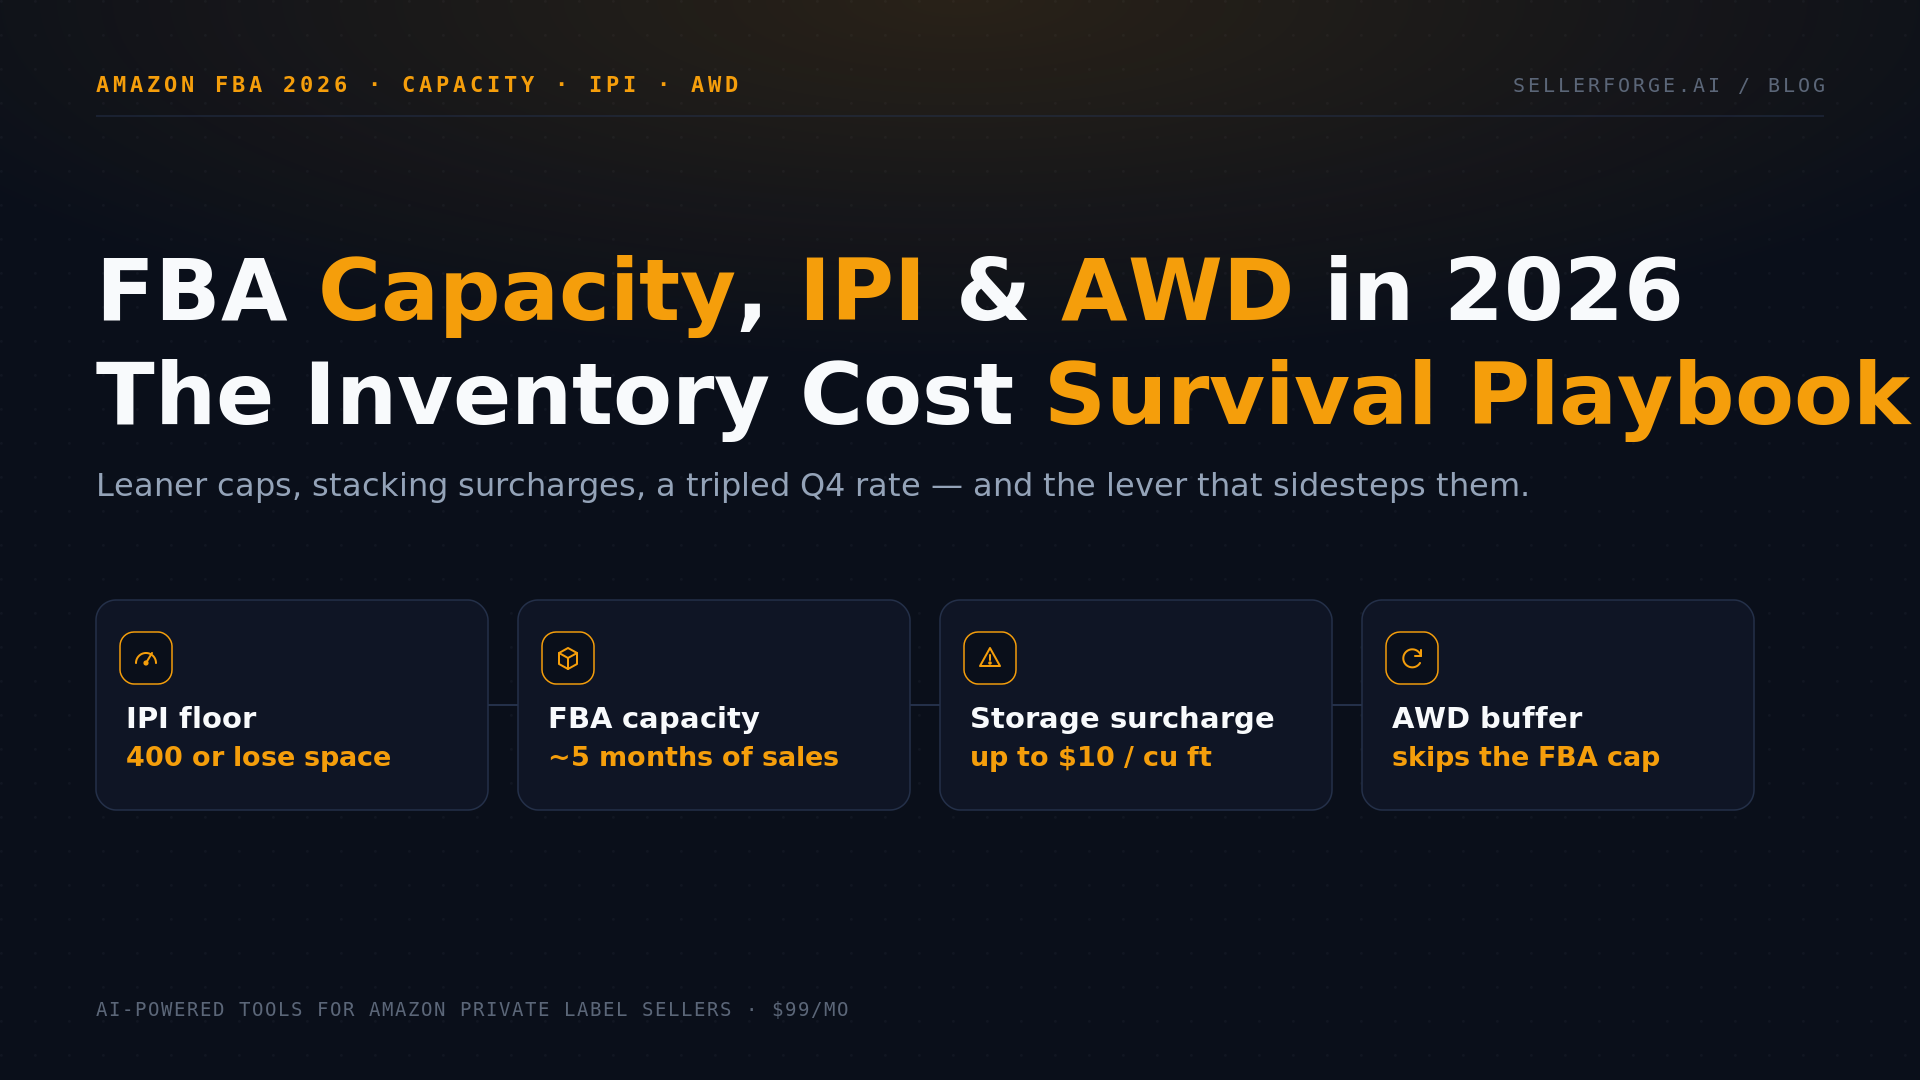
Amazon caps how much you can send to FBA through monthly capacity limits measured in cubic feet, driven largely by your Inventory Performance Index (IPI). Keep IPI at 400 or above to avoid storage restrictions — below 400 triggers immediate cubic-foot limits and ASIN-level restock caps that can strand an otherwise sound reorder plan.
IPI is a rolling 13-week score, updated weekly, built from four factors: excess inventory, sell-through rate, stranded inventory (units unsellable due to listing issues), and in-stock rate. Two of those four reward keeping products in stock, and two punish overstock and dead inventory — so the index itself embodies the balance this whole guide is about. Fix stranded listings promptly and liquidate genuinely dead SKUs; both are the fastest ways to lift a struggling IPI. New sellers get a grace period (no storage limits for the first several weeks after their initial calculation), but everyone else should treat 400 as a hard floor and 550+ as the comfortable target.
The 2025–2026 capacity context matters for planning. In May 2025 Amazon reduced capacity allocation from roughly six months to five months of forecasted sales, so even sellers with a healthy IPI saw their headroom shrink. Capacity also tightens hardest right before Q4, exactly when you most need to send peak inventory. Plan peak shipments early, use the capacity-request tools when available, and never assume you can push a large last-minute restock into FBA in November — the room may not be there.
- IPI ≥ 550 = comfortable; 400–550 = acceptable but exposed at peak; below 400 = storage restrictions imposed
- Capacity is measured in cubic feet per month and set largely by IPI and recent sales
- Four IPI factors: excess inventory, sell-through, stranded inventory, in-stock rate
- Allocation was cut from ~6 to ~5 months of forecasted sales in May 2025
- Capacity is tightest heading into Q4 — send peak inventory early, not last-minute
How Do You Avoid Stockouts Without Overstocking?
Both failure modes are expensive, in opposite directions. Stockouts cost you organic rank, ad momentum, and the ranking honeymoon you then have to re-earn. Overstock costs monthly storage fees that roughly triple in Q4, aged-inventory surcharges past 181 days, and cash trapped in slow-moving units. The target is a tight band — enough cover to never zero out, never so much you're renting warehouse space.
The stockout side is usually the more damaging of the two, because its cost is invisible until weeks later. When a listing goes to zero, sales velocity — the single biggest input to organic rank — collapses, Best Seller Rank slips, and Sponsored Products campaigns either waste spend routing to an out-of-stock page or lose the placement momentum you paid to build. Coming back often means climbing the ranking ladder from a lower rung than where you fell off. For a fast mover, a few days out of stock can take weeks to fully recover.
The overstock side has a subtler trap in 2026: the FBA low-inventory-level fee. Amazon penalizes running too lean — standard-size products, and since January 15, 2026 Small and Large Bulky ones too, pay a per-unit fee when both their 30-day and 90-day historical days of supply fall below 28 days, measured per FNSKU — so you can't simply solve storage costs by holding as little as possible. The practical answer is a per-SKU coverage band, typically 30–60 days on hand with more before peak. SellerForge's Forecasting module projects days of cover for each SKU from your live SP-API data and flags which items to reorder now versus which are drifting toward overstock, so the band is managed by data rather than by whichever SKU last scared you.
How Should You Plan for Seasonality and Peak Events?
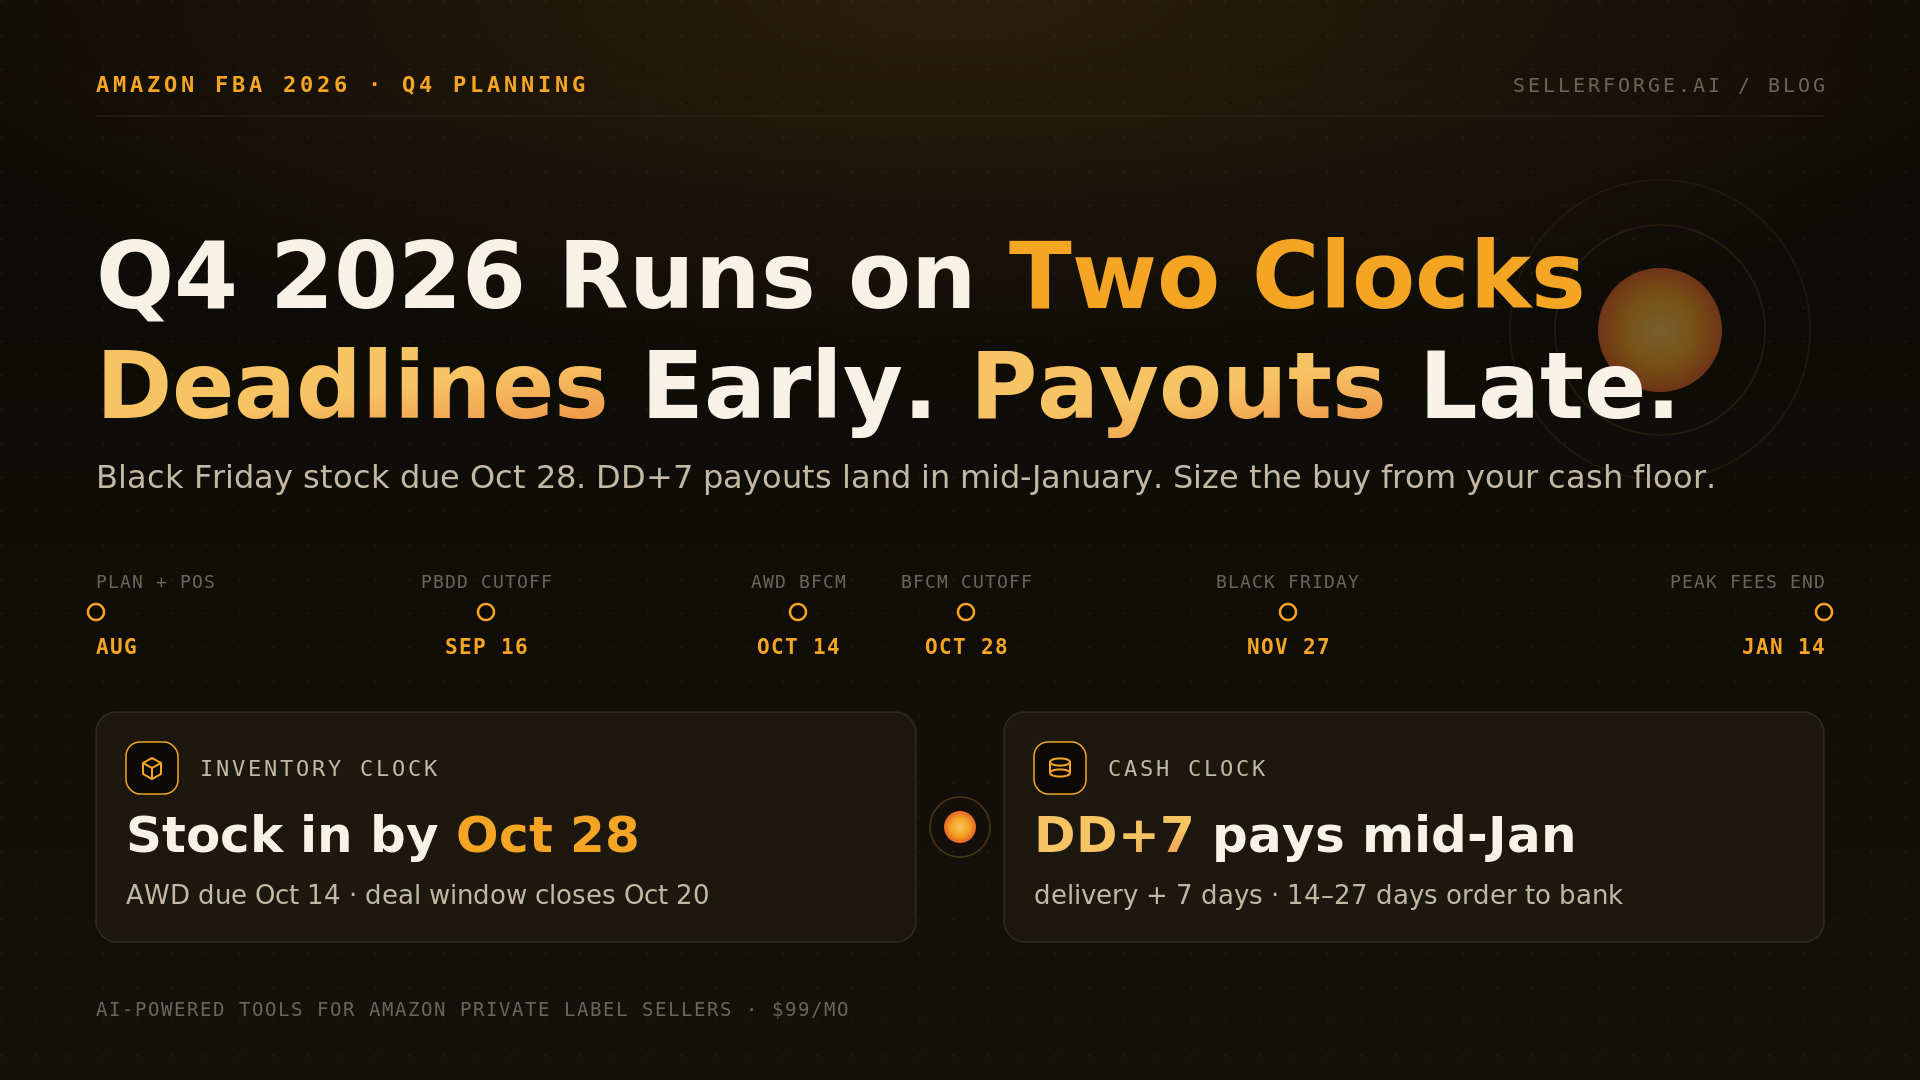
Plan seasonal inventory backwards from the event, not forwards from today. If Q4 or Prime Day demand runs 3–5x your baseline and your lead time is 90–120 days, the peak-season purchase order has to be placed months ahead — often in summer for Q4, and in spring for July Prime Day. Miss that window and no amount of expediting recovers the lost sell-through.
The Amazon calendar now has multiple peaks to plan around, not just December. July Prime Day, the fall Prime Big Deal Days event, Black Friday/Cyber Monday, and the December holiday run each pull demand forward and each requires its own inventory to be in FBA before the event, not en route during it. Layer your own category's seasonality on top: a sunscreen brand and a space-heater brand share none of the same peaks, and a generic 'Q4 is big' assumption will strand one of them.
Seasonal planning also means seasonal safety stock and a deliberate wind-down. Carry a fatter buffer going into a known spike because both demand and lead-time risk are elevated at exactly the same time. Just as important, avoid over-ordering into the tail of a season — units that arrive in January for a Q4 product sit through the highest-storage-fee months and slide toward the aged-inventory surcharge. Forecast the ramp up and the ramp down, and back every peak order out from your real replenishment lead time plus a congestion buffer.
- Identify every relevant peak: July Prime Day, fall Prime event, Black Friday/Cyber Monday, December holidays
- Back-plan each peak order from total lead time PLUS a Q4 freight/receiving congestion buffer
- Increase safety stock going into a spike — demand and supply risk peak together
- Layer category-specific seasonality on top of Amazon's event calendar
- Plan the wind-down too, so leftover peak stock doesn't age into storage surcharges
Frequently Asked Questions
3 articles in Forecasting
Stop reading. Start shipping.
SellerForge turns these playbooks into one-click AI workflows — from $49/month.
No credit card required