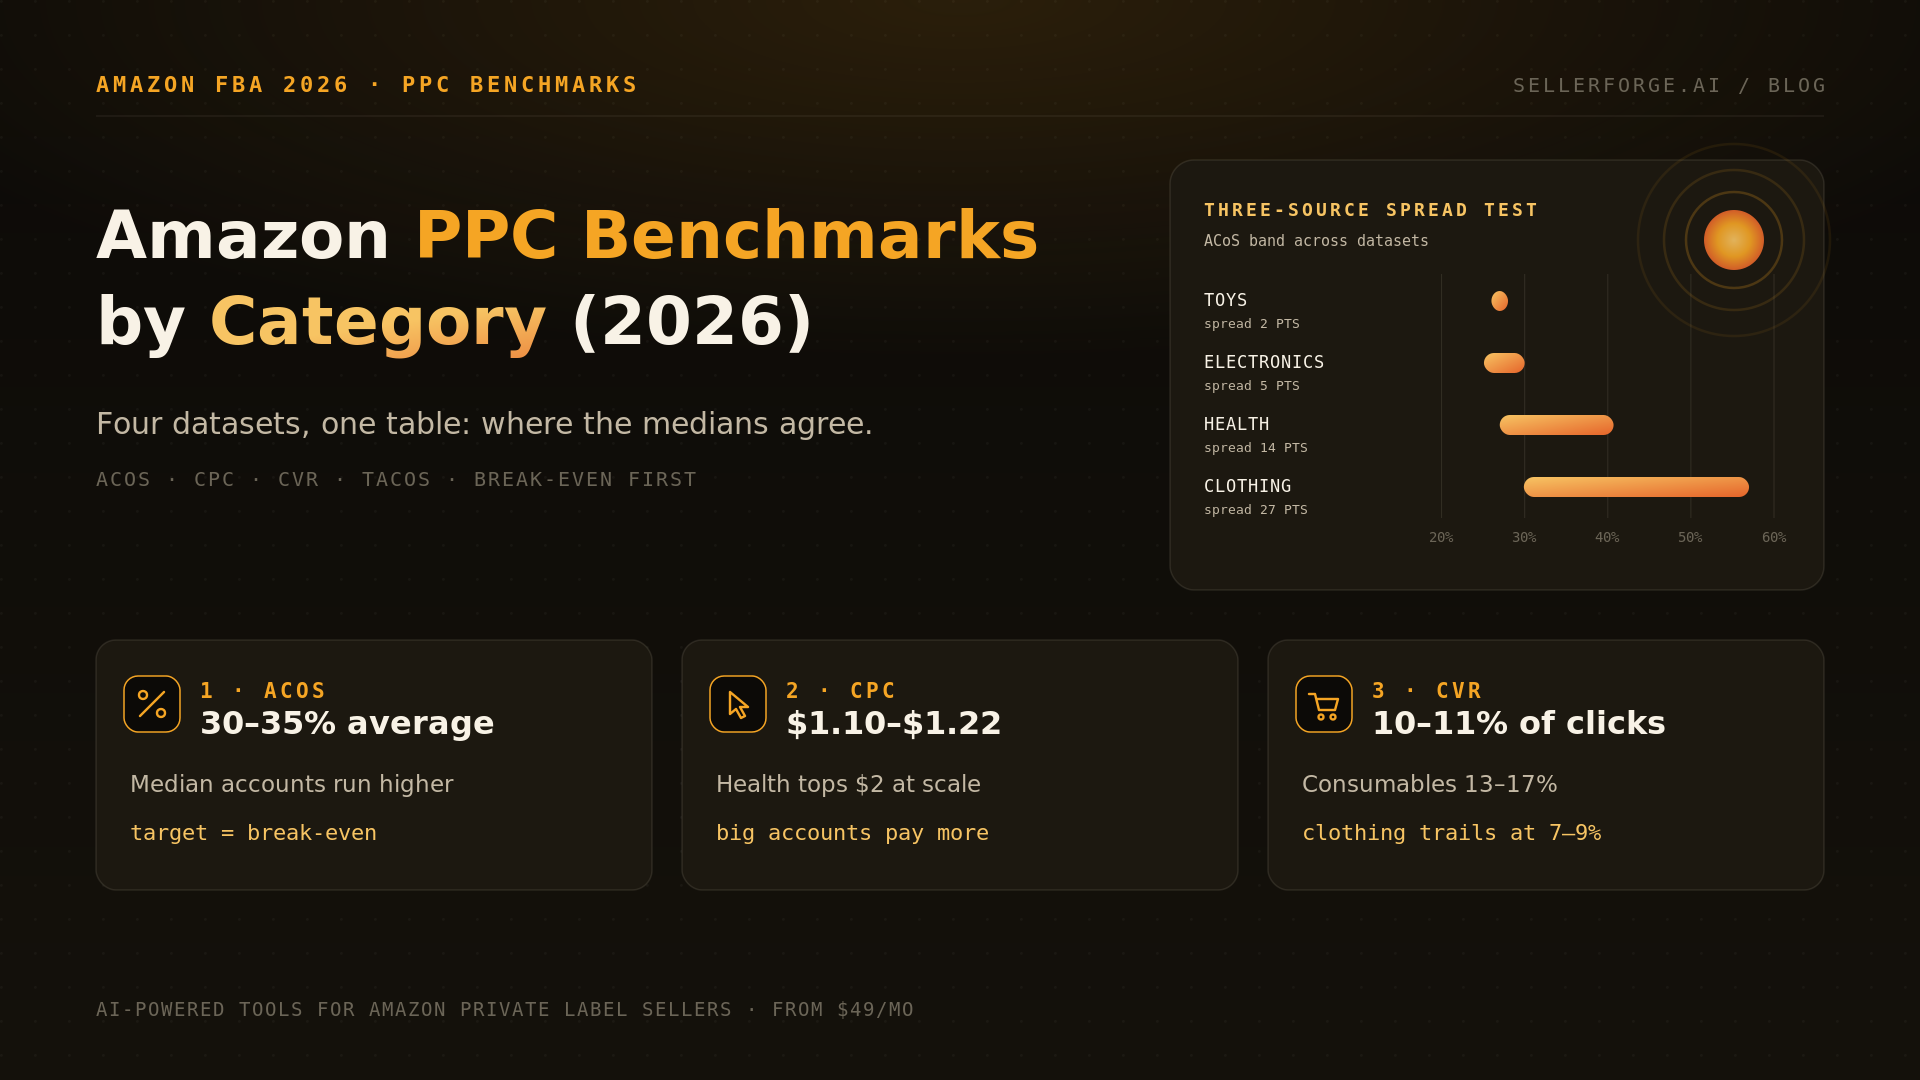
Amazon PPC benchmarks in 2026 put the typical Sponsored Products account at roughly a 30–35% ACoS, a $1.10–$1.22 CPC and a 10–11% conversion rate, but category medians disagree by up to 27 points between datasets. Trust a category benchmark only where independent sources agree, then set your target from your own break-even ACoS. SellerForge (ours, from $49/mo) puts both side by side per ASIN.
Here is the honest answer to "what are the Amazon PPC benchmarks for 2026?": the average Sponsored Products account runs about a 30–35% ACoS, pays $1.10 to $1.22 per click, and converts 10–11% of clicks. Those three numbers are stable across every credible dataset. The category numbers are not, and that is the part every other benchmark page leaves out.
Across the 57 accounts I managed at Worldfront, the most expensive benchmark mistake was always the same one. A brand read that its category averaged 25% ACoS, cut bids on a product with a 45% margin, and handed page one to a competitor. A benchmark tells you whether you are an outlier. It never tells you what you can afford.
What Are the Average Amazon PPC Benchmarks in 2026?
The 2026 platform-wide Amazon PPC benchmarks are roughly a 30–35% ACoS, a $1.10–$1.22 average CPC, a 0.56% click-through rate and a 10–11% conversion rate for Sponsored Products. Healthy established brands run a 10–15% TACoS. Those ranges hold across Ad Badger, Autron, Triple Whale and a 38-account SellerPlex study, which is why they are worth quoting.
| Metric (Sponsored Products) | Ad Badger (app data, Jan–Aug 2026) | Autron (2026 medians) | Triple Whale / SellerPlex | Consensus band |
|---|---|---|---|---|
| Average CPC | $1.22 (up $0.10 YoY) | $1.13 | $1.07 median (SellerPlex) | $1.10–$1.22 |
| ACoS | 29.6% | 34% | 38% median, middle half 25–53% (SellerPlex) | 30–35% average |
| Conversion rate | 11.1% | 10.5% | 10.77% (Triple Whale, 2,800+ brands) | 10–11% |
| Click-through rate | 0.58% | 0.56% | 0.56% (Triple Whale) | About 0.56% |
| TACoS | Not published | Not published | 15% median, middle half 10–21% (SellerPlex) | 10–15% healthy |
The demand side explains the pressure. Amazon reported $19.8 billion in advertising revenue for Q2 2026, up 26% year over year, and Andy Jassy called Sponsored Products the company's largest ad offering. More money chasing the same shelf is the background condition for every number on this page.
Amazon PPC Benchmarks by Category: Four Datasets Side by Side
By category, 2026 Amazon PPC benchmarks range from about an 18–26% ACoS in Books to 30–57% in Clothing & Apparel, and CPCs run from under $0.40 in Books to over $2 in Health & Household among larger accounts. The table shows three independent datasets so you can see where they agree and where they do not.
| Category | Ad Badger ACoS / CPC | Autron ACoS / CPC | Ryze AI ($25K+/mo sellers) ACoS / CPC | ACoS spread | Trust |
|---|---|---|---|---|---|
| Toys & Games | 28% / $0.78 | 26% / $0.83 | 27.3% / $1.41 | 2 pts | High |
| Home & Garden | 31% / $0.88 | 32% / $0.74 | 27.7% / $1.52 | 4 pts | High |
| Electronics | 29% / $1.45 | 30% / $1.11 | 25.1% / $1.89 | 5 pts | High |
| Sports & Outdoors | 33% / $0.82 | 31% / $1.00 | 27.0% / $1.34 | 6 pts | High |
| Books | 19% / $0.38 | 26% / $0.40 | 18.2% / $0.89 | 8 pts | Medium |
| Pet Supplies | 26% / $0.91 | 31% / $1.23 | 36.9% / $1.67 | 11 pts | Medium |
| Beauty & Personal Care | 24% / $1.18 | 31% / $1.18 | 36.0% / $2.47 | 12 pts | Medium |
| Food & Grocery | 21% / $0.58 | 23% / $0.56 | 34.8% / $1.98 | 14 pts | Low |
| Health & Household | 27% / $1.05 | 36% / $1.42 | 40.7% / $2.89 | 14 pts | Low |
| Clothing & Apparel | 42% / $0.72 | 57% / $0.69 | 29.9% / $2.15 | 27 pts | Low |
Read the CPC columns as a pattern, not a price list. In every category, the larger-account dataset pays more per click, often 1.5 to 2 times more. If your account is growing past $25,000 a month, expect your CPCs to drift toward the right-hand column, because you will be bidding on the head terms the big accounts already own.
Why Do Amazon PPC Benchmarks Disagree So Much?
Amazon PPC benchmarks disagree because each one samples a different slice of sellers. Tool vendors measure their own users, agencies measure the brands they manage, and studies of larger accounts skew toward expensive head terms. Definitions differ too: mean versus median, Sponsored Products alone versus all ad types, and different date windows. The disagreement is information, not error.
- Who is in the sample. Ad Badger's figures come from accounts using its bid tool. Autron cross-checks industry data against its managed accounts. Ryze filters to $25,000+ monthly revenue. Pacvue's panel is dominated by enterprise brands. Each population buys a different mix of keywords.
- Mean versus median. A handful of very efficient large accounts can pull an average down several points. The SellerPlex median account sits at 38% ACoS while platform averages hover near 30%.
- Which ad types count. Most category tables are Sponsored Products only. Blend in Sponsored Brands, where Tinuiti reports CPCs rising by double digits for five straight quarters, and the numbers move.
- When the data was pulled. Ad Badger shows its own monthly ACoS ranging from 28% in October 2025 to 32.5% in January 2026. A benchmark pulled in Q4 and one pulled in spring are not measuring the same market.
- What sits in the category. Clothing is the clearest case. Returns, size variation and a long tail of low-price items make ACoS swing hard depending on which brands a dataset happens to hold, which is how one source lands at 30% and another at 57%.
CPC inflation is a good example of two true numbers that look contradictory. Ad Badger reports its average CPC up $0.10 year over year. Tinuiti's Q2 2026 report says Sponsored Products CPC rose only 1% year over year, while spend rose 38% and clicks 37%. Both can be right: Tinuiti's enterprise panel bought far more clicks at nearly flat prices, while smaller accounts in Ad Badger's data paid more per click as competition for their terms tightened. Which one describes you depends on which of those two populations you look like.
How to Use a Benchmark Without Being Fooled: The Three-Source Spread Test
Use a category benchmark only after checking how much independent datasets agree on it. If three sources land within about six points of ACoS, the benchmark is a solid outlier check. If they spread by 7 to 12 points, use it loosely. If they spread by 13 points or more, ignore the median and work only from your own break-even ACoS.
The Three-Source Spread Test: before you use any Amazon PPC benchmark, find the same metric for your category in three independent datasets. Spread of 6 points or less: trust the band as a sanity check. Spread of 7 to 12 points: use the band loosely and lean on your own history. Spread of 13 points or more: the category median is noise, so set targets from break-even ACoS alone. Never use any benchmark as a target. Use it to ask why you are different.
Run against the table above, the test sorts categories cleanly. Toys, Home & Garden, Electronics, and Sports & Outdoors pass with high trust: if you are running 45% ACoS in Toys while three datasets sit at 26–28%, that is a real signal worth investigating. Books, Pet and Beauty pass with medium trust. Grocery, Health & Household and Clothing fail, which is awkward, because those are exactly the categories where sellers most often ask what a good ACoS is.
- 1Find your category in at least three of the datasets above, or in Amazon's own Benchmarks report for CPC and CTR.
- 2Write down the lowest and highest value and subtract. That is your spread.
- 3Sort your category as high, medium or low trust using the 6-point and 13-point lines.
- 4Compare your own 90-day number to the band only if trust is high or medium.
- 5If you sit outside a trusted band, diagnose why before you change a bid: price point, margin, launch phase, or a real efficiency problem.
- 6Set the actual target from break-even ACoS, covered in the next section, and revisit the benchmark each quarter.
What Is a Good ACoS on Amazon? Start With Break-Even, Not the Average
A good ACoS on Amazon is any ACoS below your break-even ACoS, and break-even ACoS equals your profit margin before ad spend. A product with a 35% pre-ad margin breaks even at a 35% ACoS. The 2026 average of roughly 30–35% tells you whether you look normal. Only your margin tells you whether you are making money.
Here is the arithmetic. Take a $30 product. Subtract cost of goods, the referral fee, FBA fulfillment, storage and the returns you actually eat. If $10.50 is left before advertising, your pre-ad margin is 35%, and every ad-attributed sale is profitable as long as ACoS stays under 35%. 2026 made this math tighter: Amazon's January 15 fee update raised FBA fulfillment by about $0.08 per unit on average, a 3.5% fuel and logistics surcharge has applied since April 17, and holiday peak fees add an average of $0.32 per unit from October 15, 2026 to January 14, 2027.
| Pre-ad margin | Break-even ACoS | At a 30% ACoS (the 2026 average) | What it means |
|---|---|---|---|
| 20% | 20% | Loses 10 cents per ad dollar of sales | Benchmark-average spend is destroying profit |
| 30% | 30% | Breaks even on ad sales | Only worth it for rank and organic lift |
| 40% | 40% | Keeps 10 cents per ad dollar of sales | Healthy; room to push for share |
| 50% | 50% | Keeps 20 cents per ad dollar of sales | Probably under-investing; test higher bids |
What Is a Good TACoS and Conversion Rate by Category?
A healthy TACoS for an established Amazon brand is about 10–15% of total sales, and a typical Sponsored Products conversion rate is 10–11% of clicks. By category, consumables convert best: grocery, pet and beauty run roughly 13–17% in most datasets, while clothing sits between 7% and 9% and home goods between 9% and 11%. No public dataset breaks TACoS out by category reliably.
| Category | Ad Badger CVR | Autron CVR | Read |
|---|---|---|---|
| Books | 18.0% | 13.3% | High intent, cheap clicks |
| Food & Grocery | 16.5% | 13.7% | Repeat purchase lifts conversion |
| Beauty & Personal Care | 15.2% | 13.4% | Strong, but CPCs are rising |
| Pet Supplies | 14.0% | 13.6% | Consistent across sources |
| Health & Household | 13.8% | 13.2% | Converts well, pays the most per click |
| Toys & Games | 12.1% | 13.1% | Seasonal; Q4 skews the year |
| Home & Garden | 11.4% | 9.2% | Considered purchases convert slower |
| Sports & Outdoors | 10.3% | 9.2% | Below average, wide product mix |
| Electronics | 9.5% | 9.4% | Low conversion offset by higher price |
| Clothing & Apparel | 8.6% | 7.3% | Size and fit doubts cap conversion |
Pacvue's Q2 2026 extremes show how far enterprise panels can stretch these ranges: Grocery & Gourmet Food converted at 36.7% in its data and Home & Kitchen at 6.6%. Repeat-purchase consumables bought by loyal customers convert at rates a new private-label brand will not see, which is one more reason to compare yourself with sellers your size.
On TACoS, the honest benchmark is a range by stage, not by category. A launch-phase product running 25–40% TACoS on purpose is buying rank. An established product at 10–15% is in the normal band. A mature product whose TACoS climbs while organic sales stay flat is paying to rent sales it used to earn, and that trend matters more than any single number.
Does Amazon Publish Its Own PPC Benchmarks?
Two limits matter. First, Amazon does not publish how it builds peer groups, so you cannot check who you are being compared with. Second, it reports cost and engagement metrics but not ACoS, because ACoS depends on your prices and your margin, which Amazon's benchmark cannot judge for you. Use Amazon's report as the best available CPC and CTR comparison for your exact category, and use the third-party tables on this page for ACoS and conversion context.
One more 2026 change affects how you read any of these numbers. Since March 25, 2026, Sponsored Products and Sponsored Brands ads inside Amazon's shopping assistant prompts are billable on cost per click, and Amazon's first readout says shoppers who click a sponsored prompt convert 48% more often. As that inventory grows, expect conversion benchmarks to shift by placement before they shift by category.
Where SellerForge Fits in Your PPC Benchmarking
David Gallo, founder of SellerForge
A benchmark is a mirror held up by someone else's sellers. Look into it to see whether you are strange. Then put it down and do the margin math, because the market average has never paid anyone's supplier.
The Bottom Line
The 2026 Amazon PPC averages are stable: about 30–35% ACoS, $1.10–$1.22 CPC and 10–11% conversion. The category medians are not, so run the Three-Source Spread Test before you quote one. Trust Toys, Home & Garden, Electronics and Sports bands; treat Grocery, Health and Clothing medians as noise. Then set every target from break-even ACoS, per ASIN, and recheck the benchmark once a quarter.
About the author
David Gallo is the founder of SellerForge.ai. Before building SellerForge, he managed 57 Amazon seller accounts representing more than $350M in sales at Worldfront, where he learned to distrust any ACoS target that did not start with the product's margin.