The average Amazon FBA seller nets a 15–20% profit margin in 2026. Jungle Scout's most recent published margin split (survey fielded Dec 2023–Jan 2024) found 57% of sellers clear 10% and roughly 28% clear 20%. Margins vary hard by category — beauty and supplements run 25–35% while electronics and grocery run 11–18% — and by model: private label typically nets 25–30% versus 10–20% for wholesale and arbitrage. Below 8% net, the business can't absorb a fee change.
Ask five margin questions on a seller forum and you'll get five confident answers, all unverifiable. So here is the number, sourced: the average Amazon FBA seller nets 15–20% in 2026. Jungle Scout's seller survey — the largest public dataset with a margin split, last published from a survey fielded December 2023 to January 2024 — found 57% of sellers hold net margins above 10%, and roughly 28% clear 20%. Every fee change since then has added cost, so read those shares as optimistic for 2026.
But that average hides two things this post exists to expose. First, the spread by category is wider than the average itself — beauty sellers routinely net 30% while grocery sellers fight for single digits. Second, those survey numbers are self-reported, and self-reported margins run high. When I rebuilt P&Ls across the 57 accounts I managed at Worldfront, the owner's believed margin and the real one usually differed by about five points — always in the flattering direction.
This is the benchmark page I wish had existed then: category bands, the full fee waterfall from $100 of revenue down to net, and the four places margin actually leaks.
What Is the Average Amazon FBA Profit Margin in 2026?
The average Amazon FBA seller nets a 15–20% profit margin in 2026. In Jungle Scout's most recent published margin split (survey fielded Dec 2023–Jan 2024), 57% of sellers held net margins above 10% and about 28% exceeded 20%; a healthy target band for an established private-label business is 15–25%. Below 8% sustained, the business is structurally fragile.
Business model moves the number more than effort does. Private-label sellers typically net 25–30% because they own the listing, the Buy Box, and the pricing power. Wholesale and arbitrage sellers typically net 10–20% — they compete for a shared Buy Box on price, which caps margin by design. The margin split comes from Jungle Scout's seller-earnings analysis; its newer 2025 State of the Amazon Seller report (fielded January 2025) headlines rising costs, a top concern for 40% of sellers, rather than an updated margin split.
Honesty check before you benchmark: survey margins are self-reported. Sellers who don't track every cost overestimate. If you haven't rebuilt your P&L from settlement data recently, mentally subtract five points from whatever number you believe yours is — that correction matched reality on most accounts I audited.
Amazon Profit Margin Benchmarks by Category
Net margins by category span roughly 11% to 35% in 2026. The pattern is physical and behavioral: small, light, consumable, low-return products (beauty, supplements) carry the highest margins because FBA fees are weight-based and returns are margin killers. Heavy, fragile, price-transparent, or return-prone products (electronics, apparel) carry the lowest.
| Category | Typical net margin (2026) | Why |
|---|---|---|
| Beauty & Personal Care | 25–35% | Small/light (low FBA fees), consumable, low returns |
| Health & Household | 22–30% | Same physics as beauty; subscription-friendly |
| Pet Supplies | 20–28% | Loyal repeat buyers, consumables |
| Home & Kitchen | 18–25% | Huge range; size and competition density decide |
| Sports & Outdoors | 15–22% | Seasonal demand, mid-size fee bands |
| Apparel | 12–20% | 20%+ return rates tax every sale |
| Electronics / Grocery / Toys | 11–18% | Heavy or price-transparent or return-prone |
| All categories (median) | 15–20% | The benchmark band |
Treat the bands as directional, not gospel — they aggregate 2025–2026 seller surveys and industry datasets, and the spread within a category exceeds the spread between categories. A disciplined operator in electronics can out-net a sloppy one in beauty. The bands tell you what the category physics allow; execution decides where you land inside them.
One implication worth making explicit: category benchmarks set your break-even ACoS. A 30%-margin beauty ASIN can bid where a 14%-margin electronics ASIN goes underwater. That per-ASIN math is the whole argument of the TACoS and contribution-margin-per-ASIN playbook, this cluster's pillar.
The 100→15 Waterfall: Where $100 of Amazon Revenue Goes
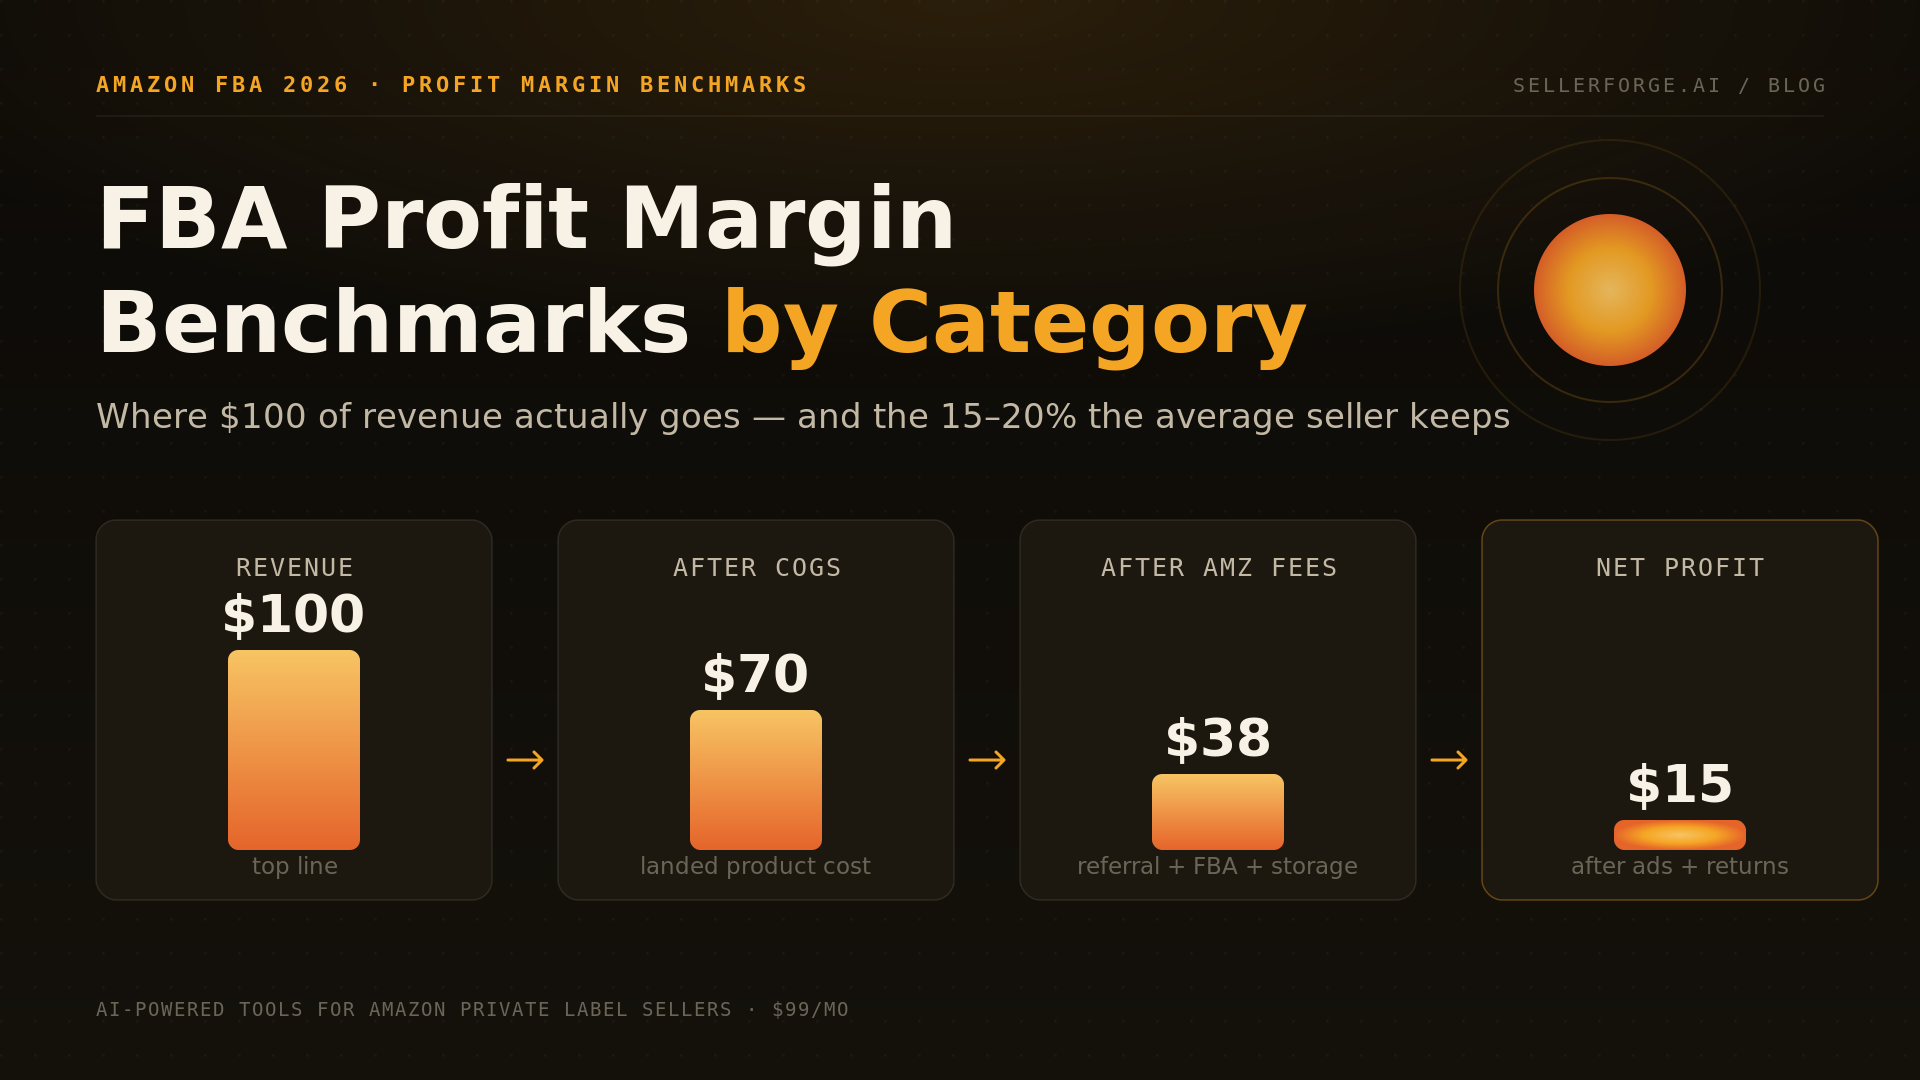
The 100→15 Waterfall is the fastest way to understand FBA economics: start with $100 of revenue and subtract the real fee stack, line by line, until net profit remains. For a typical mid-price private-label product in 2026, $100 of top-line becomes roughly $15 of net — which is exactly why the survey average sits where it does.
| Waterfall line | Typical range | Running total |
|---|---|---|
| Revenue | — | $100 |
| Landed product cost (COGS) | –$25 to –$30 | $70–75 |
| Referral fee (most categories 15%) | –$15 | $55–60 |
| FBA fulfillment + storage fees | –$20 to –$25 | $32–38 |
| Advertising (typical 10–15% of revenue) | –$10 to –$15 | $20–25 |
| Returns, refunds, damaged/lost inventory | –$3 to –$5 | $16–21 |
| Overhead (software, prep, misc.) | –$2 to –$4 | $13–18 |
| Net profit | ≈ 13–18% | ~$15 |
The fee bands aren't mine — they're Marketplace Pulse's published analysis: a 15% referral fee, 20–35% of revenue in FBA fees including storage, and up to 15% in advertising, totaling 50%+ of seller revenue going to Amazon — up from about 40% five years earlier. Run your own ASINs through the waterfall with real settlement numbers and the flattering self-reported margin usually deflates on the spot.
Two waterfall lines are levers, not laws. COGS is negotiable annually and drops meaningfully at volume breaks. Advertising is the swing line: at a 29–34% platform-average ACoS on Sponsored Products, an account leaning on ads for half its sales can easily spend 15%+ of total revenue on them, while a strong-organic-rank account spends 5%.
What Percentage Does Amazon Take From Sellers?
Amazon collects more than 50% of a typical seller's revenue in 2026 across referral fees, FBA fees, storage, and advertising, per Marketplace Pulse — with some sellers paying 60–70%. And the direction is one-way: Amazon's official 2026 US fee update raised FBA fulfillment fees an average of $0.08 per unit on January 15, 2026 (referral fees unchanged at 8–15% by category), and added a 3.5% fuel surcharge on fulfillment fees effective April 17, 2026.
An average of $0.08 sounds benign until you apply the waterfall: on a $25 product netting 15%, that's $3.75 of profit per unit — an extra $0.08 of fee plus the fuel surcharge quietly claims 3–4% of your net. Fee changes never feel like margin events in the announcement. They only show up as margin events in your December P&L.
The January 2026 restructure has more moving parts than the average suggests — size-tier and price-band changes hit some SKUs far harder than others. The line-by-line breakdown is in the 2026 FBA fee changes and DD+7 payments guide, and the inbound side (placement fees, the 5-warehouse split decision) is in the inbound placement fee playbook.
Why Is My Amazon Profit Margin So Low? The Four Usual Leaks
When an account's net margin sits below its category band, the cause is almost always one of four leaks — and they're ordered here by how often they turn out to be the culprit. Across the accounts I managed, leak #1 explained more underperformance than the other three combined.
- 1Advertising above category norm. Platform-average Sponsored Products ACoS runs 29–34% in 2026 (Ad Badger and Autron benchmark data), but category norms range from ~21% (grocery) to ~42% (apparel). If your TACoS has crept up while sales stayed flat, ads are eating your margin — audit search terms and cut the bottom 20% of spend first.
- 2Fulfillment-fee band mismatch. FBA fees are size- and weight-tiered; a product 0.1 inch or 0.5 oz over a band boundary pays the higher tier on every unit forever. Re-measure your top SKUs — packaging redesigns that drop a tier are the highest-ROI margin fix that exists.
- 3Returns. A 5% return rate costs far more than 5% of revenue once you count the refund, return processing, and unsellable units. Apparel return rates exceed 20%, which is why apparel margins run 8–15 points below beauty despite similar gross margins.
- 4Silent leakage. Monthly and aged storage fees, inbound placement fees, and — the one sellers forget — FBA errors Amazon owes you for: lost inventory, damaged units, mis-weighed fee overcharges. Unclaimed reimbursements typically recover 1–3% of annual revenue when systematically audited.
Leak #3 got structurally worse in 2026 — the returns processing fee now directly bills high-return SKUs. The defense system (return-reason triage, the keep/fix/cut decision) is laid out in the returns-fee margin defense playbook. For leak #4, SellerForge's Reimbursement Claims module finds and files the recoverable ones automatically.
Gross vs. Net Margin: The Mistake That Flatters Every P&L
Gross margin is revenue minus product cost. Net margin subtracts everything else — referral fees, FBA fees, ads, returns, storage, overhead. On Amazon the two diverge more than in any other retail channel, because the platform fee stack sits between them and takes half the pie: a 40% gross margin product routinely nets 12–15%.
This is the single most common margin self-deception. A seller prices for 40% gross, watches revenue grow, and assumes profit is growing with it — while ad spend creeps from 8% to 14% of revenue and a fee-band bump adds $0.40 a unit. Revenue is a vanity metric on Amazon. Contribution margin per ASIN — what each product actually adds after its own fees and its own ad spend — is the honest one.
Operator rule from the Worldfront years: any margin number quoted without the word 'gross' or 'net' attached is a negotiating position, not a fact. Benchmark on net. Manage on per-ASIN contribution margin.
How to Raise Your Net Margin Without Raising Prices
Margin improvement on Amazon is a sequencing problem: the four moves below are ordered by speed-to-impact, and the first two typically add 2–5 points of net within a quarter without touching your price or your supplier.
- 1Cut the unprofitable ad spend (weeks). Pull a 60-day search-term report, compute per-target profit at your real margin, and cut everything below break-even ACoS. Almost every account has 15–25% of spend producing negative contribution.
- 2File your reimbursements (weeks). Audit 18 months of FBA transactions for lost, damaged, and fee-overcharge claims. This is found money — typically 1–3% of revenue.
- 3Attack the fee bands (one quarter). Re-measure and re-package your top 10 SKUs against the current FBA size tiers; one tier drop pays forever.
- 4Rebuild COGS annually (quarters). Renegotiate at volume, second-source, and consolidate freight. A 10% COGS cut adds ~2.5–3 points of net on a typical waterfall.
The prerequisite for all four is seeing real per-SKU numbers in one place. SellerForge's Custom Breakdowns build the per-ASIN contribution-margin view from your actual settlement data, the Advertising module computes break-even ACoS per product, and the Weekly Business Report tracks whether the four moves are actually landing — so margin management becomes a weekly habit instead of a year-end autopsy.
One more margin line worth auditing: management fees. If you pay an agency, check your total fee against the 2–5%-of-revenue benchmark in our Amazon agency pricing models comparison.
The Bottom Line
Benchmark yourself on net margin against your category band, not against the 15–20% average: 25%+ in beauty is normal and 15% in electronics is solid. Run the 100→15 Waterfall on your own top SKUs with settlement data, find which of the four leaks is yours, and fix them in speed-to-impact order. The sellers still netting 25%+ in 2026 are not in magic categories — they just re-audit the waterfall every quarter while everyone else reads fee announcements and hopes.
If you want the per-ASIN margin math, the leak detection, and the reimbursement recovery running automatically, start a free SellerForge trial — it connects to your Seller Central account and rebuilds your real P&L in about 15 minutes.
About the author
David Gallo is the founder of SellerForge.ai. Before building SellerForge, he managed 57 Amazon seller accounts representing more than $350M in sales at Worldfront, where rebuilding inflated margin numbers into real ones was most of the job.