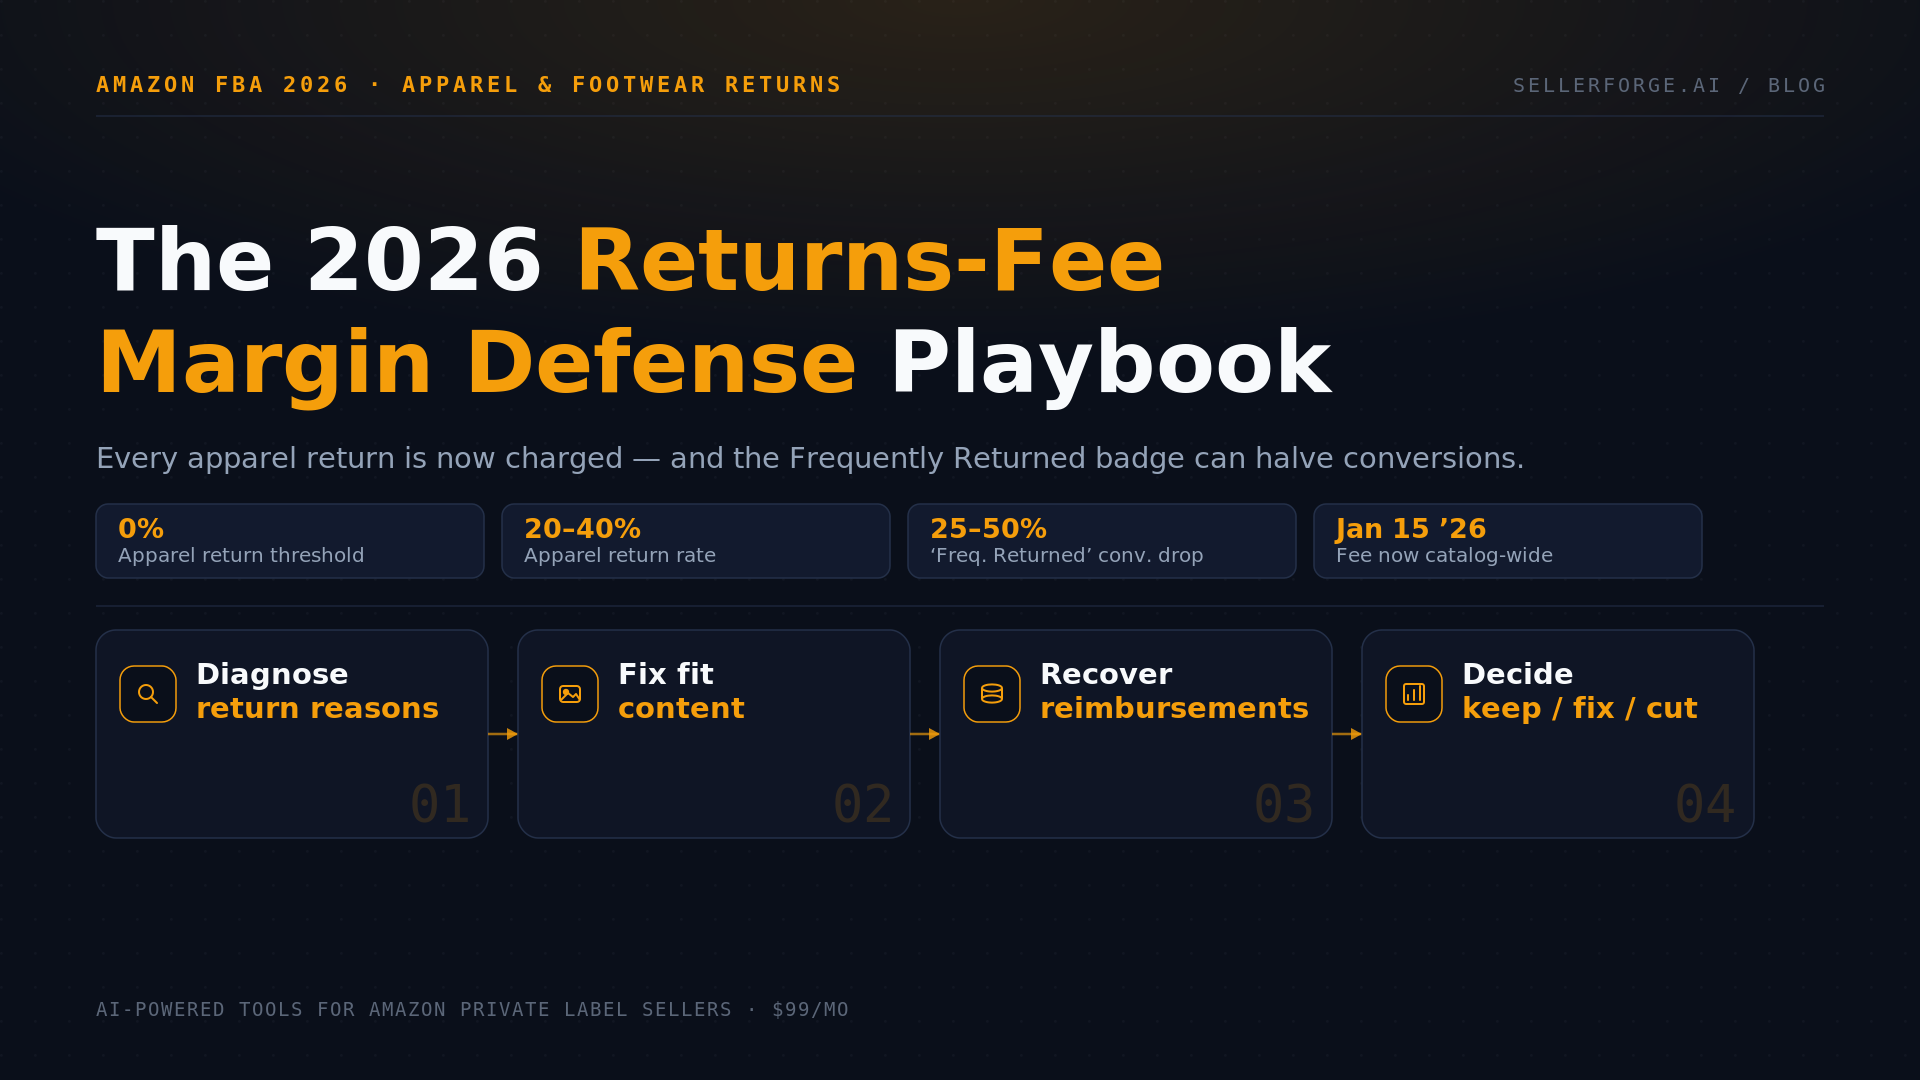
As of January 15, 2026, Amazon's returns processing fee applies to nearly every category — but apparel and shoes carry a 0% threshold, meaning every return is charged regardless of how well you perform. Layer on the Frequently Returned Item badge (expanded February 16, 2026), which can cut conversions 25–50% with no appeal, and returns become a compounding margin and ranking liability. The defense is a system: triage your return reasons, fix fit imagery and language (not just the size chart), recover wrongly-charged returns through reimbursements, and run a per-SKU contribution-margin model that tells you whether to keep, fix, or cut.
For most of Amazon's history, a return was a soft cost. You ate the shipping, you maybe tossed the unit, you moved on. It hurt, but it lived in the fuzzy part of the P&L you never quite reconciled. In 2026, that changed. Returns are now a hard, itemized fee that shows up on your statement — and a public badge that can cut your conversion rate in half.
Nowhere is this sharper than apparel and footwear. These are the highest-return categories on Amazon — clothing commonly runs 20–40% and shoes 17–30% — and they're the categories Amazon singled out for the harshest version of its new returns processing fee. If you sell soft goods, the math on every SKU you carry just shifted, and most sellers haven't re-run it.
This is the margin-defense playbook: how the 2026 returns fee actually works, why the Frequently Returned badge is a compounding trap, and the concrete system — return-reason triage, listing fixes, reimbursement recovery, and a per-SKU keep/fix/cut model — that protects your contribution margin instead of watching it bleed out one return at a time.
What Actually Changed in 2026
Amazon introduced the returns processing fee in mid-2024, but only for a limited set of categories and only on units returned above a category-specific threshold. Apparel sellers felt it first. Then, on January 15, 2026, Amazon expanded the fee to apply across nearly the entire catalog as part of its broader fee overhaul. The era of ‘returns are free until they're a problem’ is over for almost everyone.
Two details make apparel and footwear uniquely exposed. First, these categories carry a 0% threshold — there's no free band of returns, so every single returned unit is charged. A homewares seller with a 6% return rate might pay the fee on only the units above their threshold; an apparel seller pays on all of them. Second, apparel's natural return rate is the highest on the platform, so the per-unit fee gets multiplied by the largest return volume of any category.
The double hit: in 2026 a single apparel return costs you twice. Once as the returns processing fee (charged on every return, no threshold), and again as a contribution to the return rate that can trigger the Frequently Returned Item badge — which then suppresses the sales that were diluting that rate. Fee and badge feed each other.
For context on how much margin a return actually destroys relative to your category's norm, the FBA profit-margin benchmarks by category show why apparel nets 8–15 points below beauty at identical gross margins.
How the Returns Processing Fee Works
The mechanics are worth getting exactly right, because the fee is billed on a lag that hides it from the sale that caused it. Amazon calculates your return rate over a trailing three-month window and compares it to a threshold set for your specific subcategory. For most categories the fee then applies to returned units above that threshold; for apparel and shoes it applies to all of them. The charge is per returned unit, scaled by size tier and shipping weight, and it typically posts between the 7th and 15th day of the third month after the return.
That timing lag is why so many sellers under-account for it: the fee for a March return shows up in June, decoupled from the order, buried in your fee reports. If you're not pulling it back to the SKU, you're flying blind on which products are actually costing you.
Roughly where the categories sit on exposure (thresholds are relative to each subcategory's historical average, so treat this as direction, not a rate card):
| Category | Return-rate threshold | Fee exposure |
|---|---|---|
| Grocery & Gourmet | Higher threshold | Lower |
| Toys & Games | Mid threshold | Moderate |
| Home & Kitchen | Mid threshold | Moderate |
| Consumer Electronics | Lower threshold | Higher |
| Watches & Jewelry | Low threshold | Higher |
| Backpacks & Luggage | Low threshold | Higher |
| Apparel & Shoes | 0% — every return charged | Maximum |
On the dollar amount: reported figures for standard-size apparel cluster around $1.50–$5.00 per returned unit depending on size tier, with heavier and oversized goods higher. But the fee itself is the smallest part of what a return really costs you — which is the next, and most under-appreciated, point.
The True Cost of One Apparel Return
The returns processing fee is the line item you can see. The expensive part is everything around it. When a unit comes back, you generally don't get your original outbound FBA fulfillment fee back — you paid to ship a sale that reversed. Amazon keeps a refund administration fee (commonly 20% of the referral fee, capped). There's the reverse-logistics and grading cost. And a real fraction of apparel returns can't go back out as new — worn, washed, or repackaged units get graded as unsellable and written off or liquidated for pennies.
Add it up and a returned $35 shirt rarely costs you ‘just’ the $1.65 fee. A realistic all-in drag — unrefunded outbound fee, returns processing fee, refund administration fee, reverse logistics, and a partial write-off allowance — lands closer to $8–$14 per return for a standard apparel unit. That's the number that should drive decisions, and it's why a 28% return rate quietly destroys an otherwise healthy SKU.
The Frequently Returned Item Badge: A Conversion Tax With No Appeal
Running parallel to the fee is a reputational penalty. Amazon's ‘Frequently Returned Item’ badge — which it expanded and made far more prominent on February 16, 2026 — appears on detail pages whose return rate runs noticeably higher than similar products, telling shoppers to check the details and reviews before buying. Reported conversion drops range from 25% to 50%.
Here's the trap. There is no appeal. The only way off the badge is to push your return rate back below the category threshold and hold it there — Amazon's stated bar is roughly 30 consecutive days, but real-world recovery runs 60–120 days. And the badge actively works against you while you're trying to escape it: by suppressing conversions, it shrinks your sales volume, which makes each subsequent return a larger percentage of the total, which keeps the rate elevated. Left alone, it's a downward spiral — lower conversions, falling rank, a return rate that won't come down because the denominator is collapsing.
You can see your badge status before shoppers do. In Seller Central, go to Performance → Voice of the Customer, where Amazon surfaces return-rate metrics and badge status by ASIN. Treat any listing flagged ‘at risk’ as a five-alarm fire — it's cheaper to fix the listing now than to claw back out of the badge later.
Build a Return-Reason Triage System
You cannot fix a return rate you haven't diagnosed. The single highest-leverage habit is turning your raw return data into a ranked list of root causes you can actually act on. Pull the FBA customer returns report and the return-reason data in Voice of the Customer, then sort every return into one of four buckets:
- 1Fit — ‘too large,’ ‘too small.’ The dominant apparel/footwear reason, and almost always fixable on the listing through sizing guidance and imagery.
- 2Expectation gap — ‘not as described,’ ‘style/color mismatch,’ ‘material not as expected.’ A listing problem: your photos or copy oversold or mis-set the buyer’s mental picture.
- 3Quality/defect — ‘poor quality,’ ‘defective,’ ‘damaged.’ A product, QC, or packaging problem that no listing edit will solve.
- 4Changed mind / accidental / no-longer-needed — largely outside your control, useful mainly as a baseline to subtract from the fixable buckets.
The triage matters because the buckets have completely different owners and fixes. Fit and expectation-gap returns — usually the majority in apparel — are listing problems you can fix this week. Quality returns are a supplier conversation. Lumping them together is how sellers waste a month ‘improving the listing’ on a SKU whose real problem was a seam that fails in the wash. Diagnose first, then deploy the right fix.
The same triage protects your Account Health, not just your margins: returned units that re-enter sellable inventory ungraded are the top source of used sold as new complaints, and the removal-order cadence that catches them is laid out there.
Fix the Listing, Not Just the Size Chart
When the returns are fit and expectation driven, the instinct is to upload a better size chart and call it done. Charts help — Amazon cites up to ~32% return reduction from accurate sizing — but on their own they rarely move the needle, because a chart only works as confirmation for a shopper who has already built fit confidence from your images and words. The chart closes the deal; it doesn't make the case.
The levers that actually reduce fit returns, in rough order of impact:
- Fit imagery: on-body shots across multiple body types, with a visible scale reference and the model’s height and the size they’re wearing stated on the image. Let the shopper see themselves in it.
- Explicit fit language in the bullets: ‘Runs small — size up if you’re between sizes,’ ‘Relaxed through the hip,’ ‘True to size.’ Say the thing buyers are guessing about.
- Garment measurements and fabric detail: flat measurements per size, fabric weight, and stretch/recovery — the data that lets a confident buyer self-select correctly.
- A dedicated A+ fit module that combines the chart, the measurements, and a ‘how to measure yourself’ visual in one place.
- Reduce bracketing: when the listing makes the right size obvious, fewer shoppers buy two sizes ‘to try,’ which is a major hidden source of guaranteed returns.
Amazon’s Fit Insights tool, available to apparel and shoe brands, is the diagnostic layer here: it uses returns data, your size chart, and customer fit feedback to pinpoint exactly where sizing expectations break. Pair its findings with the four-bucket triage above and you stop guessing.
This is the same listing-quality discipline we cover elsewhere, applied to a specific KPI. For the broader visual and semantic playbook — how Amazon’s AI now reads your images and A+ content — see Answer Engine Optimization for Amazon, and for a full pre-flight on any listing, the Amazon Listing Audit Checklist.
Recover the Fees You Shouldn’t Be Paying
Reducing returns is the long game. Recovering money you’ve already lost is the fast one — and on returns specifically, a meaningful share of charges are recoverable. Not every returned unit is genuinely your cost. Amazon handles millions of reverse-logistics events, and a predictable fraction go wrong in your favor (financially) without anyone telling you.
The recurring reimbursement opportunities on returns:
- Refunded but not returned: the customer was refunded but never sent the unit back within Amazon’s window — you’re owed the value or the unit.
- Damaged or lost in reverse logistics: the return came back damaged by the carrier or warehouse, or vanished after the refund — not a defect you caused.
- Returned but never restocked: a sellable unit came back but was never added back to your available inventory.
- Fee misapplications: a returns processing fee, weight, or size-tier charged incorrectly.
None of these reverse automatically. They sit in the returns and reimbursements reports until someone reconciles them and files a claim within Amazon’s deadlines. Recovering them won’t lower your return rate, but it recaptures margin that’s already gone — and for a high-return apparel catalog, that recovered amount is often several thousand dollars a quarter hiding in plain sight.
SellerForge’s Reimbursement Claims module scans your returns and inventory ledgers for exactly these discrepancies, assembles the evidence, and prepares the case so you’re not manually cross-referencing CSVs at midnight. It’s the cleanest dollar-per-hour work in the whole returns problem.
The Per-SKU Decision: Keep, Fix, or Cut
Put the pieces together and every soft-goods SKU needs to pass a contribution-margin test that includes its full return drag — not the sticker margin you calculated when you launched. The question isn’t ‘is this product profitable per sale?’ It’s ‘is this product profitable per sale, net of what its returns cost me?’
Here’s the model on a single SKU — 1,000 gross units sold, using an illustrative all-in cost of ~$9 per return (unrefunded outbound fee + returns processing fee + refund administration + reverse logistics + partial write-off). Watch what dropping the return rate from 28% to 18% does:
| Metric | At 28% returns | At 18% returns (after fix) |
|---|---|---|
| Gross units sold | 1,000 | 1,000 |
| Units returned | 280 | 180 |
| All-in return cost (~$9/return) | −$2,520 | −$1,620 |
| Return drag per gross unit | −$2.52 | −$1.62 |
| Annualized drag (12,000 units/yr) | −$30,240 | −$19,440 |
| Margin recovered per year | — | +$10,800 |
On a thin apparel contribution margin, a ten-point return-rate improvement worth ~$0.90 per unit is frequently the difference between a SKU that funds the business and one that quietly drains it. That gives you a clean decision rule: if a SKU’s contribution margin after return drag is healthy, keep and protect it; if it’s marginal but the returns are fit/expectation driven, fix the listing on a deadline and re-measure; if it’s negative after drag and the cause is quality, cut it — liquidate before the 181-day aged-inventory surcharge clock (another 2026 change) compounds the loss.
Don’t average this across your catalog. Returns concentrate. A handful of problem SKUs usually generate a wildly disproportionate share of both the fee and the badge risk, while the rest of your line is fine. The whole game is finding those few and acting — which means you need the data at the SKU level, not the account level.
The keep/fix/cut call above is the returns-specific case of a general model: every ASIN's ad ceiling is its own contribution margin after all of this lands. The full version — the 2026 waterfall, the break-even ACoS it produces, and the TACoS trend that decides whether to scale or pull back — is in the per-ASIN contribution-margin model.
Where SellerForge Fits
Every step above depends on returns data being sliced, reconciled, and tied back to the listing and the fee — which is exactly the unglamorous work that doesn’t happen when you’re running a brand off spreadsheets and the standard reports.
See the problem SKUs. Custom Breakdowns lets you rank every ASIN by return rate, return-reason mix, and — critically — contribution margin net of the returns processing fee, so the handful of SKUs driving your fee and badge risk surface immediately instead of hiding in the catalog average.
Fix the fit gap. The Listing Audit scores your fit imagery, sizing language, and A+ content against what actually reduces returns, with specific rewrite suggestions — and the Deliverable Builder turns the fixes into a clean size-chart and fit-content brief you can hand straight to a designer or photographer.
Recover what you’re owed. Reimbursement Claims hunts the returns and inventory ledgers for refunded-not-returned, lost, damaged, and mischarged units and builds the claim for you.
Prove the fix worked. Log a listing change on the Business Event Timeline, and your Weekly Business Report shows whether the return rate actually moved after it — so you know if the fit edit paid off or the real problem is quality. And the built-in AI Assistant knows your catalog, so ‘which of my apparel SKUs is closest to the Frequently Returned threshold?’ is a question you can just ask.
For how this returns picture fits into the wider 2026 cost overhaul — fuel surcharge, per-FNSKU low-inventory fees, aged-inventory changes — see The 2026 FBA Fee Overhaul Survival Guide.
The Bottom Line
Returns used to be the cost you didn’t look at too closely. In 2026, Amazon made sure you can’t look away: a per-unit fee on every apparel and footwear return, billed on a lag, plus a public badge that punishes the rate itself. The sellers who win soft goods from here aren’t the ones with zero returns — that doesn’t exist — they’re the ones who treat returns as a managed line item with an owner, a target, and a weekly number.
Diagnose the reasons. Fix the fit story, not just the chart. Claim back what you’re owed. And run the keep/fix/cut math on every SKU with the full return drag baked in. Do that and returns go from a silent margin leak to a number you control.
Want to see your real return drag by SKU — and which listings are closest to the badge? Start a free SellerForge trial and run your apparel catalog through Custom Breakdowns and the Listing Audit. The problem SKUs show up in minutes.
About the author
David Gallo is the founder of SellerForge.ai. He previously managed 57 Amazon accounts representing over $350M in sales at Worldfront before building SellerForge to give sellers AI-powered tools at agency quality without the agency price.