Two of your ASINs ran a 28% ACoS last month. By the one number on most sellers' dashboards, they're twins — both under the roughly 30% account average, both comfortably 'fine.' One of them is quietly your most profitable product. The other loses money on every unit it sells. ACoS cannot tell them apart. Contribution margin can.
This is the central problem with managing Amazon advertising the way most sellers still do. The metric that should govern every ad dollar isn't how efficiently a campaign spends in isolation — it's how much real profit each ASIN keeps after Amazon, your supplier, your returns, and your ad spend have all taken their cut. In 2026, with average CPCs up 15–25% year over year and FBA fees climbing again, the gap between 'good ACoS' and 'good business' has never been wider.
This is the per-ASIN profit model: how to build the contribution-margin waterfall honestly, derive your break-even and target ACoS from it, and use TACoS as the bridge between campaign efficiency and the number that actually pays you. It's the working companion to our overview of the metrics smart sellers track — less about what to watch, more about the model you run.
ACoS governs the campaign, not the business
ACoS — advertising cost of sale, ad spend divided by ad-attributed revenue — answers one narrow question: is this campaign efficient on its own terms? That's a useful question. It's just not the question that decides whether you make money.
The 2026 context makes the limitation sharper. Amazon advertising is now a $50-billion-plus business, the average account runs somewhere around a 30–32% ACoS (most land between 25% and 36%), and average cost-per-click sits near $1.00–$1.25 after climbing 15–25% year over year across most categories. Efficiency is getting more expensive to buy. Against that backdrop, ACoS is blind to three things that actually determine your profit: your real margin on the unit, the organic sales your ads create or fail to create, and the costs that land after the sale — returns, peak-season storage, the fee that changed in January.
The classic failure mode is a stable, low ACoS while organic sales quietly erode and contribution margin compresses underneath it. ACoS produces no signal for that. You can hit your ACoS target every single month and watch your bank balance shrink, because the number was never measuring the thing you care about.
Most sellers overestimate their margin by five to ten percentage points — because advertising, returns, and inbound shipping never make it into the math. A 'healthy' ACoS sitting on top of an unmeasured margin is not transparency. It's a blind spot with a green dashboard.
The honest number: contribution margin per ASIN
Contribution margin is what a single unit contributes to your fixed costs and profit after every variable cost of selling that unit is stripped out. Per ASIN, those costs are knowable — you can build the whole waterfall from data you already have. Start at the sale price and subtract, in order:
- Referral fee — 8–15% of the sale price depending on category (15% for most private-label categories).
- FBA fulfillment fee — the per-unit pick-pack-ship charge for the size and weight tier.
- Storage, allocated per unit — roughly $0.78 per cubic foot per month January–September, rising to about $1.02 in the October–December peak.
- Inbound placement, allocated per unit — the 2026 restructure added roughly $0.05 per unit for standard items unless you split shipments across multiple fulfillment centers.
- Landed cost of goods — unit cost plus freight and duty, not just the supplier invoice.
- Returns provision — your return rate times the cost to process each return, plus the returns-processing fee now applied in high-return categories like apparel.
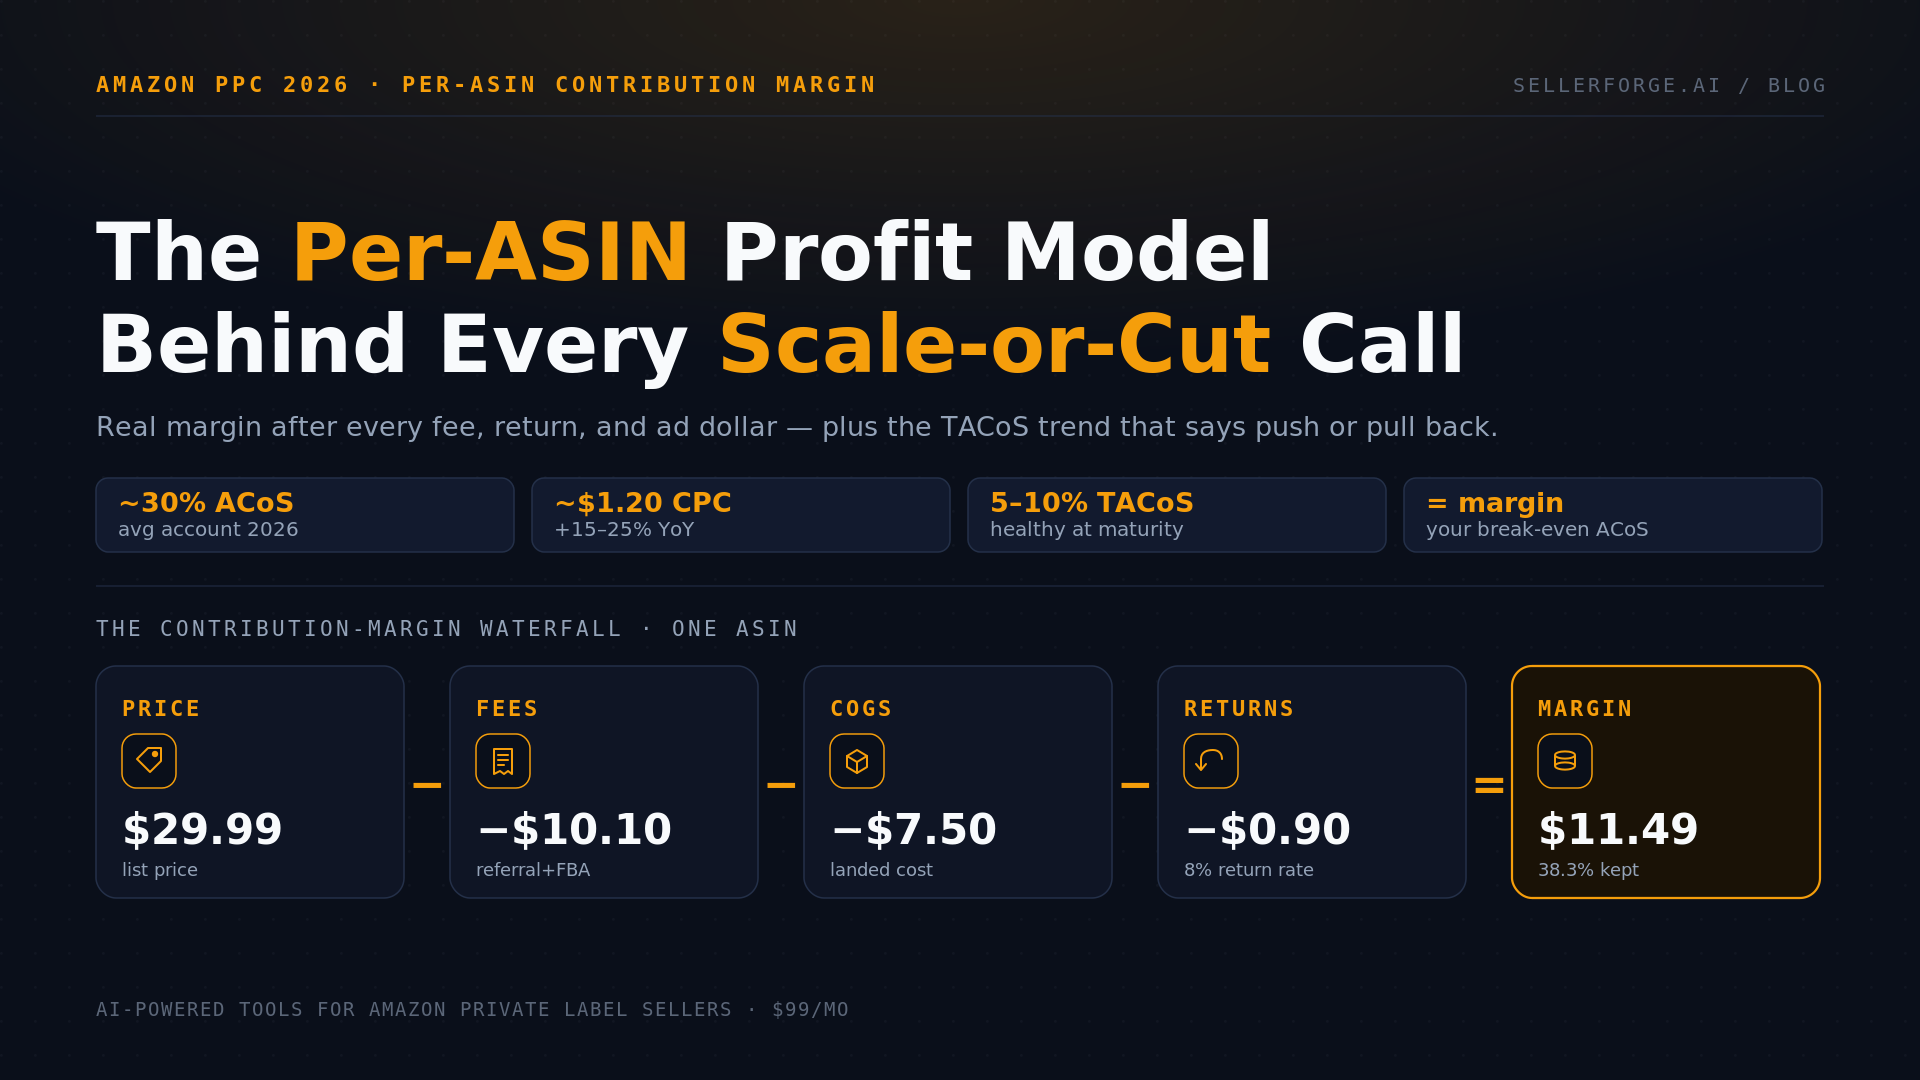
What's left is your contribution margin before advertising — the real pool of money each sale generates. Here's the waterfall on a $29.99 ASIN:
| Line item | Per unit | Notes |
|---|---|---|
| Sale price | $29.99 | List price the buyer pays |
| Referral fee (15%) | −$4.50 | Category referral rate |
| FBA fulfillment fee | −$5.20 | Size/weight tier, 2026 schedule |
| Storage (allocated) | −$0.25 | Blended; higher in Q4 peak |
| Inbound placement (allocated) | −$0.15 | Lower if you split shipments |
| Landed COGS | −$7.50 | Unit + freight + duty |
| Returns provision (8% rate) | −$0.90 | Processing + lost units |
| Contribution margin (before ads) | $11.49 (38.3%) | The money each sale actually generates |
Notice what isn't in that table: advertising. We've kept it out deliberately, because the margin before ads is the input you use to decide how much advertising a unit can afford in the first place. That's the next step.
Your break-even ACoS is just your margin
Here's the clean relationship most sellers never connect: your break-even ACoS equals your contribution margin percentage before advertising. The $29.99 ASIN above keeps $11.49 per unit, or 38.3%. So any ad-driven sale at an ACoS below 38.3% adds profit; anything above 38.3% loses money on that unit. That single number — derived from the margin, not pulled from an industry average — is the actual ceiling.
But break-even isn't the target; it's the cliff edge. Your target ACoS is lower than break-even by the margin you want to keep on ad-driven units. The formula:
Target ACoS = Break-even ACoS − Desired contribution margin. For the $29.99 ASIN, if you want to keep 20 points of margin on ad-driven sales: 38.3% − 20% = an 18.3% target ACoS.
Now look at what this does to the popular 'keep ACoS under 30%' rule. For this 38.3%-margin product, a 30% ACoS is profitable — it clears break-even with room to spare. For a 22%-margin product, a 30% ACoS is underwater on every ad-driven unit. Same rule, opposite outcomes, because the rule ignored the only variable that mattered: the margin. A blanket ACoS target misprices most of a real catalog, and it does it invisibly.
TACoS: the bridge from campaign to catalog
ACoS judges the ad-driven unit. But you don't only sell ad-driven units — and your ads either lift organic rank or they don't. TACoS (total advertising cost of sale: total ad spend divided by total revenue, ad plus organic) captures what ACoS structurally can't: the share of your entire top line you're paying to advertising.
The diagnostic TACoS gives you is whether advertising is building organic velocity or renting it. A TACoS that falls while total revenue grows means your ads are compounding — you're spending the same or less and generating more total revenue because organic rank is climbing. A TACoS that's flat or rising while revenue stalls means ads are substituting for organic demand instead of building on top of it. ACoS can look identical in both cases; TACoS tells them apart.
The 2026 benchmarks, by lifecycle stage — with the strong caveat that the trend matters more than the level:
- Mature, established product: a healthy TACoS around 5–10%. Sustained above ~15% at maturity usually signals a structural problem (organic rank slipping, a listing or review issue, a new competitor).
- Growth phase (roughly months 3–9): TACoS should be trending down toward 12–20% as organic sales climb and reviews accumulate.
- New launch: a TACoS of 25% or higher can be a smart, deliberate investment to build velocity and penetrate the category.
Read the direction, not just the dot. A 22% TACoS on a six-month-old product that was 30% last quarter is a flywheel spinning up. The same 22% on a three-year-old product that was 9% last year is a flywheel grinding down. The number is the same; the businesses are opposite.
Don't run one target across the catalog — run a portfolio
Put margin and TACoS together and the implication is that you should never apply one efficiency target to the whole catalog. Doing so simultaneously underfunds your launches (which need aggressive spend to build rank) and overspends your earners (which should be protecting margin). Instead, allocate by lifecycle stage and margin profile. Four archetypes cover most catalogs:
| Archetype | Stage / margin | TACoS posture | Target ACoS | Judged on |
|---|---|---|---|---|
| Launch Star | New, healthy margin, building rank | High by design (20–30%+) | At or above break-even, temporarily | Rank & velocity, not profit |
| Growth Climber | Months ~3–9, margin intact | Trending down to 12–20% | Below break-even | The downward trend |
| Mature Cash Cow | Established, strong organic | Low ceiling (5–10%) | Well below break-even | Protected contribution margin |
| Decliner / Thin-margin | Losing rank, or <15% margin before ads | Minimize | Defensive only, or none | Whether to advertise at all |
This is also where the 2026 AI bid tools cut both ways. Amazon's Ads Agent moved into beta this year (early testers report 12–18% ACoS improvements and 30–40% time savings), and the majority of campaigns now run on some form of AI-driven management. But an automated bidder optimizes to whatever target you hand it. Feed it a single account-wide ACoS goal and it will efficiently execute exactly the wrong thing — squeezing your launches to hit a number they shouldn't be hitting yet, and leaving margin on the table on your cash cows. The bidder is only as smart as the per-ASIN target underneath it.
The scale / hold / fix / cut decision
Now the model earns its keep. Cross two axes — contribution margin (healthy vs. thin) and the TACoS trend (improving vs. deteriorating) — and every ASIN lands in one of four quadrants, each with a clear action:
- 1Healthy margin + falling TACoS → SCALE. Ads are compounding on a product that can afford them. Push budget; this is where growth dollars earn the most.
- 2Healthy margin + rising TACoS → HOLD & DIAGNOSE. The product earns, but ads are renting demand. Find the cause — a competitor entry, a listing slip, a stockout suppressing rank — before you add a dollar.
- 3Thin margin + falling TACoS → FIX THE MARGIN. The flywheel works, but the unit barely pays. Re-source COGS, raise price, or cut a fee (re-check the size tier, attack the return rate) before scaling.
- 4Thin margin + rising TACoS → CUT. You're funding a money-loser whose organic isn't responding. Pull back to defensive spend or exit the ASIN.
This is the decision the whole per-ASIN model exists to make. ACoS alone can't place an ASIN on this grid — it has no axis for margin and no axis for organic trend. The grid is only visible once you've built the margin waterfall and you're tracking TACoS direction.
A worked example: two ASINs, one ACoS, opposite answers
Return to the twins from the top. Both ran a 27% ACoS last month.
ASIN A — a $39.99 kitchen tool with a 42% contribution margin before ads, a 9% TACoS that's been falling for two quarters. Its 27% ACoS sits well under its 42% break-even, and the falling TACoS proves the spend is compounding into organic rank. Healthy margin, improving trend: scale it. This is where the next thousand ad dollars should go.
ASIN B — a $24.99 apparel accessory with a 19% contribution margin before ads (after the returns-processing fee on a 22% return rate chews through it), a 21% TACoS that's flat and well above the maturity red line. Its 27% ACoS is above its ~19% break-even, so every ad-driven unit loses money, and the high flat TACoS says organic isn't responding. Thin margin, deteriorating trend: fix the margin or cut. Either attack the return rate and sizing or pull the spend back to defensive.
Same 27% ACoS. Opposite businesses, opposite actions. A dashboard that shows only ACoS told you they were the same product — and would have had you treat them the same way.
Why you can't build this once and forget it
The reason this is hard isn't the math on any single ASIN — it's that every input moves, constantly, and the answer changes when they do. Amazon adjusted FBA fees again in 2026; CPCs are up 15–25% year over year; the returns provision shifts with season and with the returns-processing fee; storage fees rise from roughly $0.78 to $1.02 per cubic foot in the Q4 peak. A contribution-margin model built in January is simply wrong by Q4.
Worse, two of the biggest line items lag the sale. Returns land weeks after the order, and the December storage bill arrives long after the unit shipped — so a SKU that looks profitable today can be underwater once the return and the peak-season storage charge post. The mechanics of the fee side are covered in our 2026 FBA fee overhaul survival guide, and the returns-fee math in the returns-fee margin defense playbook. The point here is that doing this by hand, across a real catalog, every time an input moves, is the work almost nobody actually sustains. That's the gap.
Where SellerForge fits
The hard part of all of this isn't understanding the model — it's keeping it live across a real catalog and turning it into a weekly decision instead of a quarterly spreadsheet archaeology project. That's exactly what SellerForge is built to automate.
TACoS-first advertising that knows each ASIN's margin. The SellerForge Advertising module leads with TACoS, derives a target ACoS from each ASIN's real contribution margin rather than an account average, and flags which products to scale, hold, fix, or cut — so your bids (or your AI bidder) are pointed at the right target in the first place. More on the metric framework in Beyond ACoS: the four metrics smart sellers track.
The per-ASIN portfolio view. Custom Breakdowns let you build exactly the contribution-margin view this model needs — sliced by lifecycle stage, margin band, or category — so the scale/fix/cut quadrants are something you read off a screen instead of reconstructing by hand.
Inputs that stay current. The Forecasting module keeps landed cost, fees, and sales velocity live, so when a fee schedule or a supplier cost moves, your break-even ACoS updates with it instead of going stale until your next accounting close.
Attribute the swings. Log a price change or a fee update once on your Business Event Timeline and the AI will correctly correlate a TACoS or margin swing to it, instead of you guessing which of five changes moved the number.
Share the P&L, and ask in plain English. The Deliverable Builder turns the per-ASIN economics into a clean report for a partner or lender, and the built-in AI Assistant can answer 'which of my ASINs are running an ACoS above their break-even margin?' against your actual account data — a question a generic chatbot can't touch because it doesn't know your numbers.
The bottom line
ACoS tells you whether a campaign is efficient. Contribution margin tells you whether a product is even worth advertising. TACoS tells you whether your ads are building the business or renting it. Manage to only the first and you'll optimize your way into stable, efficient, unprofitable campaigns. Run all three — per ASIN, as a portfolio — and 'scale or cut' stops being a gut call and becomes a number you can read.
If you'd rather not rebuild a per-ASIN contribution-margin model by hand every time Amazon moves a fee or your CPCs climb, start a free SellerForge trial and connect your account. The Advertising and Custom Breakdowns modules build this view continuously — so next quarter's scaling decisions are a dashboard read, not a spreadsheet rebuild.
About the author
David Gallo is the founder of SellerForge.ai. He previously managed 57 Amazon accounts representing over $350M in sales at Worldfront before building SellerForge to give sellers AI-powered tools at agency quality without the agency price.
Frequently Asked Questions
What is contribution margin per ASIN on Amazon?
Contribution margin per ASIN is what one unit of a product contributes toward your fixed costs and profit after every variable cost of selling that unit is removed. You start with the sale price and subtract the referral fee, the FBA fulfillment fee, allocated storage and inbound-placement fees, your landed cost of goods (unit cost plus freight and duty), and a provision for returns. The result is your contribution margin before advertising — the real pool of money each sale generates, and the number that determines how much you can afford to spend on ads to win that sale.
What is the difference between ACoS, TACoS, and contribution margin?
ACoS (ad spend ÷ ad-attributed sales) measures the efficiency of a campaign in isolation. TACoS (ad spend ÷ total sales, ad plus organic) measures advertising's impact on your whole top line and reveals whether ads are building organic rank or substituting for it. Contribution margin measures the actual profit a unit keeps after all variable costs. ACoS judges the campaign, TACoS judges the channel, and contribution margin judges the product. You need all three: margin tells you what you can afford to spend, ACoS tells you whether a given unit cleared that bar, and the TACoS trend tells you whether the spend is compounding.
How do you calculate break-even ACoS?
Break-even ACoS equals your contribution margin percentage before advertising. If a unit sells for $29.99 and you keep $11.49 after fees, COGS, storage, and returns, your contribution margin is 38.3% — so any ad-driven sale at an ACoS below 38.3% adds profit, and anything above it loses money on that unit. Your target ACoS is lower than break-even by the margin you want to keep: if you want to retain 20 points of contribution margin on ad-driven units, target ACoS = 38.3% − 20% = 18.3%. Because the margin differs by ASIN, the break-even (and target) ACoS differs by ASIN too — which is why a single account-wide ACoS rule misprices most of your catalog.
What is a good TACoS in 2026?
It depends on the product's lifecycle stage, and the trend matters more than the absolute number. For a mature, established product with a strong organic foundation, a healthy TACoS sits around 5–10%; sustained above roughly 15% at maturity usually signals a structural problem. A new launch can justify a TACoS of 25% or higher as a deliberate investment to build velocity and rank. During the growth phase (roughly months three to nine), TACoS should be trending down toward 12–20% as organic sales climb. A TACoS that falls while total revenue grows is the signal you want — it means your ads are compounding into organic rank rather than renting demand.
Should every product have the same ACoS or TACoS target?
No. Applying one efficiency target to an entire catalog simultaneously underfunds your launches and overspends your earners. Targets should be set per ASIN as a function of two things: the product's lifecycle stage and its contribution-margin profile. A launch-stage product with healthy margin should run a high TACoS by design to build rank; a mature cash cow should run a low TACoS ceiling to protect contribution margin; a thin-margin or declining product should get minimal defensive spend or none. The correct ACoS for a product is computed from its own margin and stage, not borrowed from an account average.
When should I scale versus cut an Amazon PPC campaign?
Cross two signals: contribution margin (healthy or thin) and the TACoS trend (improving or deteriorating). Healthy margin plus falling TACoS means ads are compounding on a product that can afford them — scale. Healthy margin plus rising TACoS means the product earns but ads are renting demand — hold and diagnose the cause (a competitor entry, a listing slip, a stockout suppressing rank) before adding spend. Thin margin plus falling TACoS means the flywheel works but the unit barely pays — fix the margin (re-source COGS, raise price, cut a fee) before scaling. Thin margin plus rising TACoS means you're funding a money-loser whose organic isn't responding — cut to defensive spend or exit.
Why is my ACoS good but my profit low?
Because ACoS only sees ad-attributed revenue and ignores your actual margin, your returns, your storage, and your organic trend. You can hold a stable, low ACoS while organic sales quietly decline (so total revenue falls even as the campaign looks efficient) and while returns, peak-season storage, and a fee increase eat the margin the dashboard never showed. Most sellers overestimate their margin by five to ten points because advertising, returns, and inbound shipping never make it into the calculation. The fix is to manage to per-ASIN contribution margin and TACoS, not ACoS alone.
How often should I recalculate per-ASIN contribution margin?
Whenever an input moves, and at minimum quarterly. The variables that feed the model are not static: Amazon adjusted FBA fees again in 2026, average CPCs are up roughly 15–25% year over year, returns provisions shift with season and with the returns-processing fee in high-return categories, and storage fees rise sharply in the Q4 peak (from about $0.78 to $1.02 per cubic foot per month). A margin model built in January is wrong by Q4. The practical answer is to keep the inputs live — recompute when you send new inventory, change a price, or see a fee change land — which is exactly the kind of continuous calculation worth automating rather than rebuilding by hand.
Amazon seller with 12+ years managing private label brands across 57 accounts and $350M+ in sales managed.


Get Amazon seller insights in your inbox
Practical strategies, SP-API updates, and AI tooling tips — no fluff.
No spam, ever. Unsubscribe anytime.