The average Amazon conversion rate is about 10 to 11% of ad clicks and roughly 4 to 12% of sessions (unit session percentage), depending on category and dataset. Consumables such as grocery, pet and beauty convert highest; apparel and big-ticket items lowest. Compare yourself only with a benchmark that uses your denominator (sessions or clicks), and audit the listing in SellerForge (ours, from $49/mo) when you fall below band.
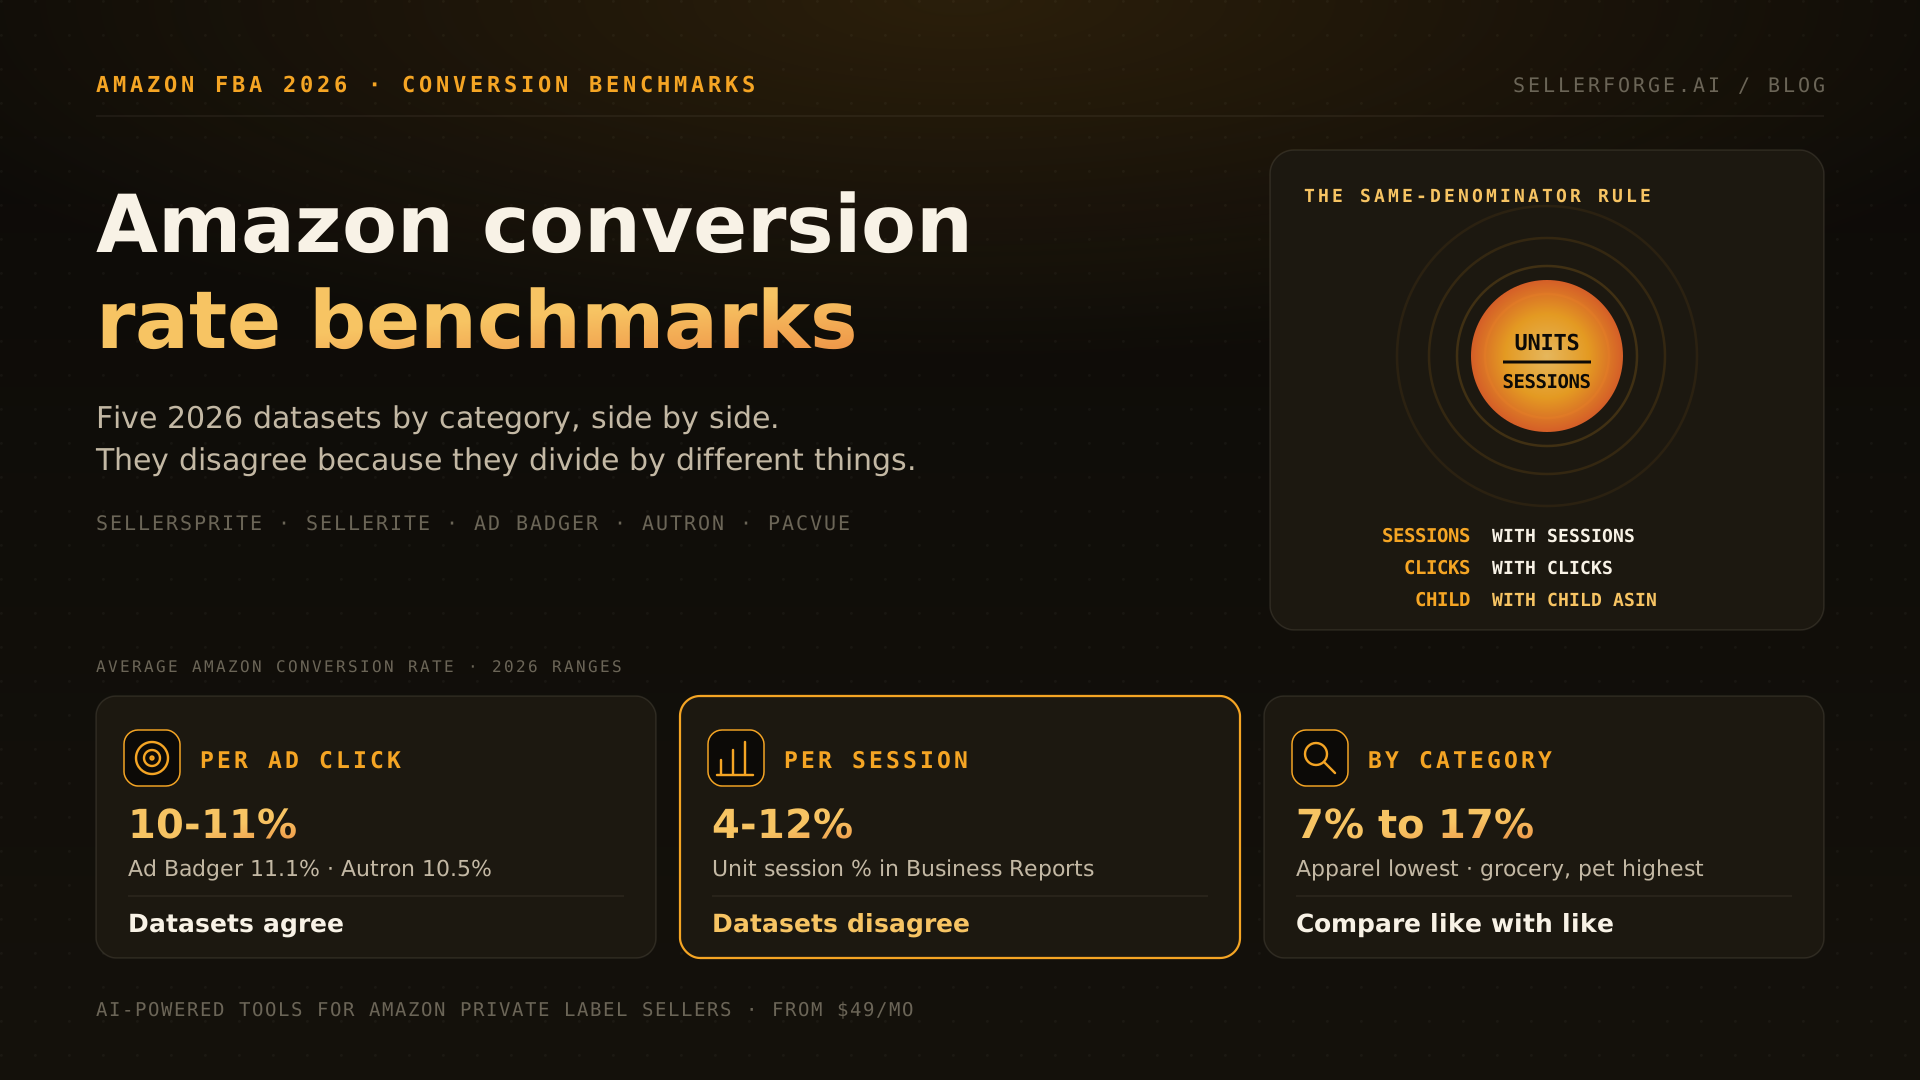
The average Amazon conversion rate is about 10 to 11% of ad clicks and roughly 4 to 12% of sessions, depending on the category. Those two numbers are not in conflict. They divide by different things, and almost every confusing benchmark on page one comes from mixing them up.
I pulled every credible 2026 dataset I could find, put them side by side by category, and marked where they agree and where they fall apart. The short version: grocery, pet, beauty and health convert best; apparel and big-ticket electronics convert worst; and the spread between sources is wide enough that picking the wrong one can send you rewriting a listing that was fine.
What Is the Average Conversion Rate on Amazon?
Measured per ad click, the average Amazon conversion rate is 10 to 11%: Ad Badger's January to August 2026 data shows 11.1% and Autron's June 2026 average 10.5%. Measured per session, the unit session percentage most sellers see in Business Reports, typical listings land between 4% and 12%, with consumables higher and considered purchases lower.
For context, standalone ecommerce stores convert at roughly 1 to 3% of sessions, per the same Jungle Scout article. Amazon shoppers arrive with intent, a saved card and Prime shipping, so a 3% Amazon listing is not doing well just because it beats a Shopify store.
Amazon Conversion Rate by Category: Five Datasets Side by Side
By category, 2026 Amazon conversion benchmarks run highest in Food and Grocery, Pet Supplies, Beauty and Health (roughly 13 to 17% per ad click) and lowest in Clothing (7 to 9% per click, 3 to 6% per session). Electronics is the category where sources disagree most: anywhere from 4% to 15%, depending on whose sample you read.
| Category | SellerSprite (sessions, Jun 2026) | Sellerite organic (sessions, Feb 2026) | Ad Badger (ad clicks, Jan-Aug 2026) | Autron average (ad clicks, Jun 2026) | Agreement |
|---|---|---|---|---|---|
| All categories | 4-7% (Jul 2026 guide) | 8-12% | 11.1% | 10.5% | Split by denominator |
| Food & Grocery | n/a | n/a | 16.5% | 13.7% | High |
| Pet Supplies | n/a | 10-16% | 14.0% | 13.6% | High |
| Health & Household | 7-11% | n/a | 13.8% | 13.2% | Medium |
| Beauty & Personal Care | 6-9% | 15-25% | 15.2% | 13.4% | Low |
| Toys & Games | 5-8% | n/a | 12.1% | 13.1% | Medium |
| Home & Kitchen / Garden | 8-12% | 8-12% | 11.4% | 9.2% | High |
| Electronics | 10-15% | 4-8% | 9.5% | 9.4% | Low |
| Clothing & Apparel | 3-6% | n/a | 8.6% | 7.3% | Medium |
Two readings matter. First, the click-based columns agree with each other far better than the session-based ones; the ad datasets sit within about 3 points in every category. Second, the two session-based sources flatly contradict each other on Electronics and Beauty. SellerSprite ranks Electronics top and Beauty near the bottom; Sellerite does the reverse. SellerSprite's own July guide also gives a lower all-category average than its May category table implies. When one vendor's two pages disagree, treat both as directional.
Why Do Amazon Conversion Rate Benchmarks Disagree So Much?
Amazon conversion benchmarks disagree because they divide different numerators by different denominators across different samples. Units or orders, sessions or clicks, all sellers or top performers, child or parent ASINs: each choice moves the number by several points, and most published benchmarks do not say which choices they made.
- 1Clicks versus sessions. An ad click is a shopper who searched, saw your ad and chose it. A session is anyone who reached the page within 24 hours, including people comparing from a competitor's listing, a deal page or a browse node. Click conversion is structurally higher.
- 2Units versus orders. Unit session percentage counts units, so a buyer who takes a 3-pack as three units, or orders two, lifts it. Order-based rates run lower on any product people buy in multiples.
- 3Who is in the sample. A dataset of top-performing sellers, an agency's managed accounts or a tool's own customers is not the median seller. Bigger brands have more branded search, and branded search converts far higher than generic search.
- 4What the category contains. Electronics includes $8 cables and $800 monitors. A sample heavy in accessories converts like a consumable; a sample heavy in hardware converts like furniture.
- 5Child versus parent ASIN. A parent rolls up every variation. A strong best-selling size can hide three weak ones, and a family-level rate is not comparable with a single-SKU benchmark.
The Same-Denominator Rule: How to Use a Benchmark Without Being Fooled
The Same-Denominator Rule says you should never compare two Amazon conversion rates unless both share the same numerator (units or orders) and the same denominator (sessions, page views or ad clicks). Business Reports rates go next to session benchmarks. Campaign console rates go next to click benchmarks. Everything else is noise.
I started using this rule after watching a client panic over a 9% unit session percentage because a blog said the category averaged 14%. The 14% was Sponsored Products click conversion. Their ads converted at 15%. Nothing was broken; we had been comparing a session number with a click number. Across the 57 accounts I managed at Worldfront, that single mix-up generated more needless listing rewrites than any real conversion problem.
- 1Write down which number you are judging: unit session percentage from Business Reports, or conversion rate from the ad console.
- 2Find a benchmark that uses the same denominator. For sessions, use the session-based columns above; for clicks, use Ad Badger or Autron.
- 3Match the numerator. If the benchmark is order-based and you sell multipacks, calculate Total Order Items divided by Sessions as well.
- 4Match the unit of analysis: child ASIN against child-level benchmarks, never a parent roll-up against a single-SKU figure.
- 5Read your number as a band, not a target. Within 3 points of the benchmark is normal variation; more than 30% below it is a signal worth chasing.
The Same-Denominator Rule in one line: sessions with sessions, clicks with clicks, units with units, child with child. If you cannot tell what a benchmark divides by, do not use it to judge your listing.
What Is a Good Unit Session Percentage on Amazon?
A good unit session percentage is roughly 10 to 15% for consumables and repeat-purchase products and 5 to 10% for considered purchases. Under 3% on a non-luxury item almost always means something structural is wrong. Above 20% is excellent, but check whether multipacks, repeat buyers or heavy branded search are inflating it before you call it a win.
The table below is my operating read of the published ranges, not another dataset. It is how I triage a listing on day one: find the band, then work the first fix before touching copy.
| Unit session % (child ASIN) | What it usually means | First thing to check |
|---|---|---|
| Under 3% | Structural problem, not copy | Featured Offer %, suppressed variation, price vs page one, reviews under 4 stars |
| 3-5% | Below band for most categories; normal for high-ticket | Main image and title against the top three competitors; review count |
| 5-10% | Typical for considered purchases; weak for consumables | Price position, bullet clarity, A+ and video, ad search terms that do not match |
| 10-15% | Healthy for most categories; strong for considered purchases | Protect it: stock, Featured Offer, review velocity; scale traffic |
| 15-20% | Strong; common in grocery, pet and beauty | Whether traffic is mostly branded; room to push generic terms |
| Over 20% | Excellent or inflated | Multipacks, repeat buyers, a small session base; compare order-based rate |
Why Is My Amazon Conversion Rate Low? Check the Featured Offer First
The most common hidden cause of a low Amazon conversion rate is losing the Featured Offer on your own listing. Sessions count every visitor to the detail page regardless of who holds the Buy Box, so when another seller or Amazon wins the offer, you keep the session and lose the sale. Check Featured Offer percentage before rewriting anything.
In Business Reports, the Detail Page Sales and Traffic by Child Item view shows Featured Offer (Buy Box) percentage next to sessions and unit session percentage. A private-label brand with no resellers should sit near 100%. If it is at 70%, roughly a third of your sessions saw someone else's offer, and no copy change will fix that.
- Featured Offer below about 95% on a private-label ASIN: check for a hijacker, an unmatched price, a pricing-error suppression or an inventory gap.
- Sessions up, units flat: look at where the new traffic came from. A new broad-match ad or a deal page can add browsers who were never going to buy.
- Conversion down across a whole variation family: a parent-child change or a suppressed child often drags the family before anyone notices.
- Conversion down on one child only: compare its price, review count and main image against the sibling that converts best.
How to Calculate Your Real Amazon Conversion Rate, Step by Step
To calculate your real Amazon conversion rate, export Detail Page Sales and Traffic by Child Item from Business Reports for the last 30 days, divide units ordered by sessions for each child ASIN, and compare each result with a session-based benchmark for its category. Then repeat with Total Order Items to get the order-based rate.
- 1In Seller Central, open Reports, then Business Reports, then Detail Page Sales and Traffic by Child Item, and set a 30-day range that excludes Prime Day or a big deal week.
- 2Download the file and keep Sessions - Total, Units Ordered, Total Order Items, Unit Session Percentage and Featured Offer (Buy Box) Percentage.
- 3Drop any child with fewer than about 300 sessions in the period. Small bases swing wildly and will mislead you.
- 4Calculate Units Ordered divided by Sessions (this should match Amazon's Unit Session Percentage) and Total Order Items divided by Sessions.
- 5Tag each child with its category and price band, then place it in the band table above. Note any child under 95% Featured Offer separately.
- 6Pull Sponsored Products conversion rate (orders divided by clicks) from the ad console for the same dates and compare it only with the click-based columns.
- 7Re-run monthly. A falling trend on the same child ASIN is a much stronger signal than any single benchmark comparison.
One honest limit: Business Reports sessions include both mobile app and browser visits, and B2B sessions are reported separately when you sell to Amazon Business customers. If B2B is a meaningful share of your sales, check the B2B rate on its own; business buyers convert differently.
Does Amazon Publish Its Own Conversion Rate Benchmarks?
No. Amazon does not publish category conversion rate benchmarks for sellers. Amazon Ads Benchmarks reporting, generally available since May 18, 2026, lets brand-registered advertisers compare click-through rate, cost per click, CPM and new-to-brand metrics with category peers, but it leaves conversion rate out. Every conversion benchmark online is third-party.
Enterprise retail-media panels are the closest thing to an official read, and they show how high branded traffic can push the number. Pacvue's 2026 mid-year report, as summarized by beBOLD Digital in August 2026, put Sponsored Brands conversion at 26.5% in Q2 2026. beBOLD does not define the metric, but it reads as click conversion on headline ads, which skew toward branded and high-intent searches, so it is not a target for an average Sponsored Products campaign, let alone a session rate.
Where SellerForge Fits (and Where It Does Not)
SellerForge fits after you have found a conversion problem and need to know why. Listing Audit scores a listing across 10 dimensions, from title structure and bullet quality to images, A+ content and pricing competitiveness, and explains what is hurting it. It does not publish category conversion benchmarks; for those, use the datasets above.
| Plan | Price | Relevant to conversion work |
|---|---|---|
| Core | $49/mo | Listing Audit 25/mo, Listing Builder 15/mo; keyword research, rank tracking and core advertising |
| Growth | $99/mo ($999/yr) | Listing Audit 60/mo, Builder 40/mo; advanced ads, Forecasting, Customer Insights; Weekly Business Report |
| Pro | $199/mo | Everything in Growth with premium AI on ads, forecasting and listings; up to 10 team members |
| Agency | $499/mo | Everything in Pro across 10 client accounts ($39 each additional, up to 40) |
- Use SellerForge if: you know which ASINs are under band and want the listing, pricing and ad causes laid out per ASIN, every week.
- Skip it for now if: all you need is a benchmark number. The table in this article and your Business Reports export are free.
The Bottom Line on Amazon Conversion Benchmarks
Use 10 to 11% as the average Amazon conversion rate per ad click and 4 to 12% per session, then narrow by category. Consumables convert highest, apparel and big-ticket items lowest, and Electronics and Beauty are where datasets disagree most. Apply the Same-Denominator Rule before you trust any comparison, and check Featured Offer before you rewrite a word.
If I were auditing a new account tomorrow, I would export 30 days of child-ASIN Business Reports, sort by sessions, and look at the five biggest children first: Featured Offer, then price against page one, then reviews, then images. Most conversion problems I have found were in that order.
About the author
David Gallo is the founder of SellerForge.ai. Before building SellerForge, he managed 57 Amazon seller accounts representing more than $350M in sales at Worldfront, where conversion triage across hundreds of child ASINs was a weekly routine. He writes about Amazon operations, advertising and AI from the operator's side.