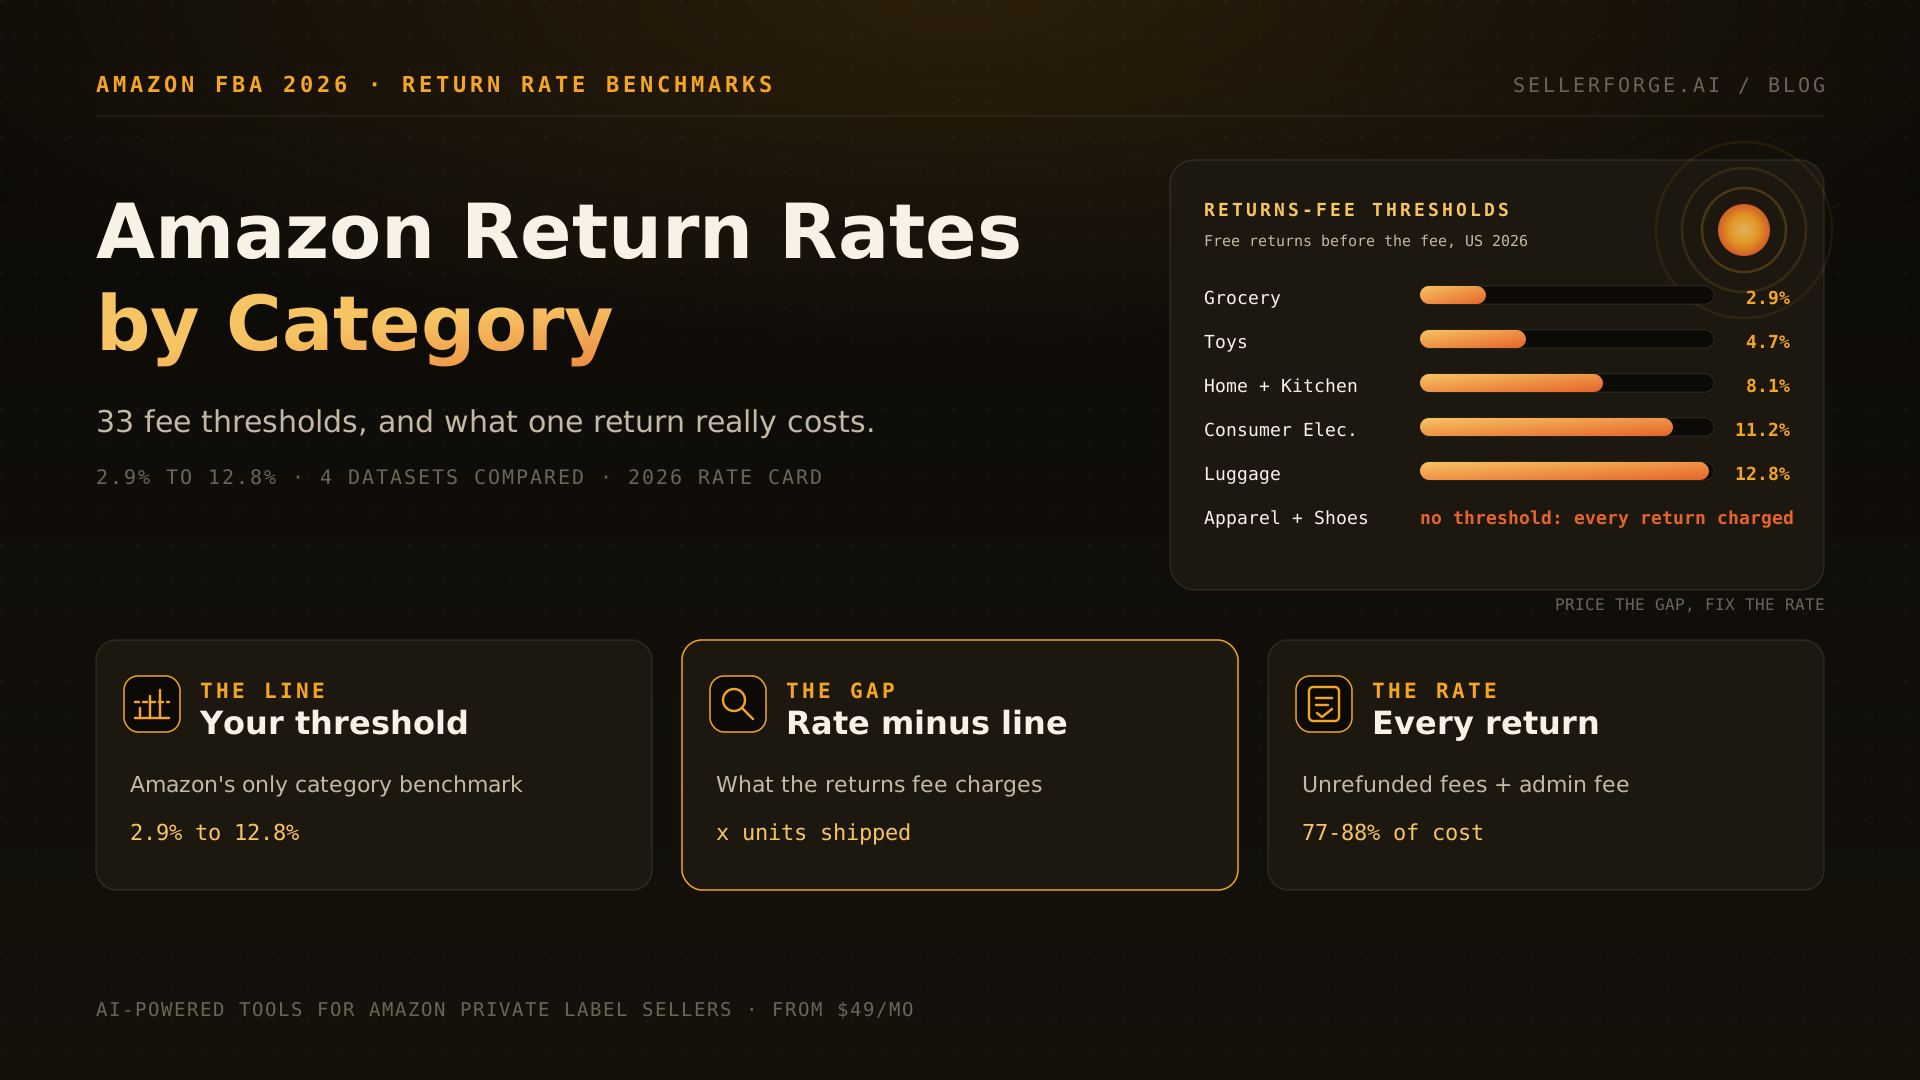
Amazon does not publish an average return rate, but its returns processing fee thresholds are the best official proxy: they run from 2.9% (Grocery) to 12.8% (Backpacks, Handbags and Luggage), and apparel and shoes have no threshold at all. Seller data puts consumables at 3–6%, home goods at 5–10%, electronics at 8–15% and apparel at 15–30%+. Benchmark against your threshold, not an average; SellerForge, our product, helps you slice and recover returns by category.
Amazon does not publish an average return rate. What it does publish, in Seller Central, is a returns-fee threshold for 33 product categories, from 2.9% for Grocery and Gourmet to 12.8% for Backpacks, Handbags and Luggage. Those thresholds are the closest thing to an official Amazon return rate by category, and they are the numbers that decide what you pay.
The short version: compare each SKU to its category threshold, not to an average. Then remember that the returns processing fee is the smallest part of what a return costs you.
What Is the Average Amazon Return Rate?
There is no official average Amazon return rate. Amazon discloses only category thresholds for its returns processing fee (2.9% to 12.8%), and seller-side data shows a range from about 3% for consumables to 30% or more for apparel. Any single blended number, including the popular 5–15% estimate, averages away the only thing that matters: your category.
Seller-level reality is lower and far more uneven. Profit-analytics data published by Sellerboard in August 2026 puts consumables, supplements and grocery at 3–6%, home, tools and kitchen at 5–10%, electronics and accessories at 8–15%, and apparel, shoes and jewelry at 15–30% or more. That spread, a factor of five to ten between categories, is why a blended average misleads.
Amazon Return Rates by Category: The 2026 Threshold Table
| Category | Returns-fee threshold | Free returns per 1,000 units shipped |
|---|---|---|
| Grocery and Gourmet | 2.9% | 29 |
| Office Products | 4.4% | 44 |
| Toys and Games | 4.7% | 47 |
| Everything Else (incl. Gift Cards) | 4.8% | 48 |
| Media (Books, DVD, Music, Software, Video) | 5.1% | 51 |
| Beauty, Health and Personal Care | 5.5% | 55 |
| Fine Art | 5.6% | 56 |
| Business, Industrial and Scientific Supplies | 6.0% | 60 |
| Video Games and Gaming Accessories | 6.5% | 65 |
| Base Equipment Power Tools | 7.1% | 71 |
| Lawn and Garden | 7.7% | 77 |
| Home and Kitchen | 8.1% | 81 |
| Sports and Outdoors | 8.7% | 87 |
| Tires | 8.7% | 87 |
| Tools and Home Improvement | 8.7% | 87 |
| Electronics Accessories | 8.8% | 88 |
| Automotive and Powersports | 9.1% | 91 |
| Musical Instruments and AV Production | 9.2% | 92 |
| Baby Products | 9.3% | 93 |
| Mattresses | 9.3% | 93 |
| Lawn Mowers and Snow Throwers | 9.5% | 95 |
| Furniture | 9.6% | 96 |
| Pet Products | 10.2% | 102 |
| Video Game Consoles | 10.7% | 107 |
| Jewelry | 10.8% | 108 |
| Consumer Electronics | 11.2% | 112 |
| Amazon Device Accessories | 11.3% | 113 |
| Computers | 11.4% | 114 |
| Full-Size Appliances | 11.9% | 119 |
| Watches | 12.0% | 120 |
| Eyewear | 12.1% | 121 |
| Compact Appliances | 12.6% | 126 |
| Backpacks, Handbags and Luggage | 12.8% | 128 |
| Apparel and Shoes | No threshold | 0 (every return is charged, separate rate card) |
Two caveats keep this honest. First, Beauty, Health and Personal Care at 5.5% appears in Sellerboard's list but not Feedvisor's; every other row matches across both. Second, I could not open the Seller Central help page itself from outside a seller login, so treat this as the best public reproduction and confirm your own category on the FBA returns pages in Seller Central before you model anything. Amazon revises thresholds, and it is the only source that binds.
Read the threshold as Amazon's line for a high-return product in that category, not as the category average. It is still the most useful benchmark you have, because it is the line that turns returns into a fee.
Which Category Has the Highest Return Rate on Amazon?
Apparel and shoes have the highest return rates on Amazon, typically 15–30% or more, and they are the only categories with no returns-fee threshold. Among the 33 threshold categories, Amazon tolerates the most returns in Backpacks, Handbags and Luggage (12.8%), Compact Appliances (12.6%), Eyewear (12.1%) and Watches (12.0%), and the fewest in Grocery and Gourmet (2.9%).
The pattern is physical and behavioral. Categories where fit, feel or visual match decide satisfaction (clothing, shoes, bags, eyewear) return the most. Categories that are cheap, consumable and hard to send back once opened (grocery, office supplies, supplements) return the least. Electronics sit in between, with returns driven by setup friction and compatibility as much as defects.
The low end deserves as much attention as the high end. Because Grocery's threshold is only 2.9%, a grocery SKU at 6% is more than double its line, while a Consumer Electronics SKU at 6% is comfortably under 11.2%. Low-return categories are not low-risk categories for the fee. They simply have less room before it starts.
Where Do Amazon Return-Rate Datasets Disagree?
Amazon return-rate datasets disagree because they measure different things: Amazon's fee thresholds, seller-tool data on Amazon accounts, agency portfolios that mix channels, and consumer surveys across all retail. Before you quote a number, check which of the four it is. These are the five contradictions I found on page one this month, and how I resolved each.
| Claim you will see | What the evidence says | How to read it |
|---|---|---|
| Apparel and shoes are exempt from the returns fee | Apparel and shoes are excluded from the threshold model only; they pay a returns processing fee on every return under their own lower rate card | Exempt from the threshold, not from the fee. Budget a fee on every apparel return. |
| Only five categories (apparel, shoes, bags, jewelry, watches) carry a returns fee | That was the pre-June 2024 model; since June 1, 2024 the threshold fee covers nearly every category | A stale page, not a different dataset. Ignore it. |
| Consumer Electronics threshold 7.7%, Jewelry 12.8%, Luggage 12.4% | The two matching rate-card reproductions say 11.2%, 10.8% and 12.8% | Trust the version two independent sources reproduce identically, then verify in Seller Central. |
| Toys, games and baby products return 'over 40%' | A June 2026 UK Prime Day projection by Manhattan Associates, with no methodology published; Amazon's US Toys threshold is 4.7% | A survey forecast for one sale event in another market. Not a category benchmark. |
| Apparel returns 35–45% on Amazon FBA | One advisory firm's estimate (Eightx, May 2026) for its DTC client portfolio, against 20–30% for apparel overall in the same study | Directionally plausible for fit-heavy lines, but a single firm's portfolio. Use it as an upper bound. |
My working rule, built from too many hours reconciling other people's benchmarks: trust a number only as far as its sample. Amazon's thresholds bind your fees. Seller-tool data describes Amazon accounts like yours. Agency portfolios describe their clients. Consumer surveys describe shoppers in general. All four are useful, and none of them substitutes for your own returns report.
How Does Amazon Calculate Your Return Rate?
For the returns processing fee, Amazon calculates a SKU's return rate as the units customers return in the month they shipped plus the next two calendar months, divided by the units shipped in that first month. It compares that rate to the category threshold and charges only the returned units above it, billed between the 7th and 15th day of the third month.
- Window: a shipment cohort, not a calendar month. June shipments collect returns through August, and any fee posts in September, which is why it rarely lines up with the sale that caused it.
- Minimum volume: SKUs shipping fewer than 25 units in a month are exempt for that month, per both rate-card reproductions.
- New products: the FBA New Selection program waives the first 20 returned units of a new-to-FBA parent ASIN received within 180 days of first inventory receipt, per Feedvisor.
- Amazon errors: returns caused by Amazon (lost, misshipped or damaged in fulfillment) do not count toward your rate.
- Returnless refunds still count as returns, so granting them does not lower your exposure.
The 2026 rate card took effect January 15, 2026. For standard-size items it runs from $1.78 (small standard, 2 oz or less) to $5.00 (large standard, first 3 lb) per charged unit, plus $0.05 per 4 oz above 3 lb; large bulky starts at $6.74 and extra-large reaches $157.35. Apparel and shoes use a lower card starting around $1.65.
The Threshold Gap: What One Return Really Costs, by Bracket
The Threshold Gap is your SKU's three-month return rate minus its category threshold. Multiply the gap by units shipped and you get the units Amazon charges. It is the right way to price the returns processing fee, but it hides a bigger truth: the fee punishes the gap, while every other return cost scales with the full rate, and those costs are larger.
To show it, I priced 1,000 units of a $25 product shipped in one month, with each SKU running three points above its category threshold. Assumptions: large standard, 8–12 oz, using the 2026 rate card ($3.05 returns processing fee, a $4.20 fulfillment fee plus the 3.5% fuel and logistics surcharge, about $4.35, that is not refunded on a return) and each category's referral rate for the refund administration fee. The apparel row uses a small standard tee, the $1.65 apparel rate-card floor, and a 20% return rate.
| Bracket (threshold) | Returns / charged units | Returns processing fee | Refund admin fee | Unrefunded fulfillment fees | Return cost per unit sold | Share of revenue |
|---|---|---|---|---|---|---|
| Grocery and Gourmet (2.9%), at 5.9% | 59 / 30 | $91.50 | $44.25 | $256.65 | $0.39 | 1.6% |
| Home and Kitchen (8.1%), at 11.1% | 111 / 30 | $91.50 | $83.25 | $482.85 | $0.66 | 2.6% |
| Consumer Electronics (11.2%), at 14.2% | 142 / 30 | $91.50 | $56.80 | $617.70 | $0.77 | 3.1% |
| Apparel (no threshold), at 20% | 200 / 200 | $330.00 | $170.00 | $700.00 | $1.20 | 4.8% |
Three things fall out of that table. The returns processing fee is identical across the first three brackets, because the gap is identical. It is also the smallest of the three lines: 23% of the return cost in Grocery, 14% in Home and Kitchen and 12% in Consumer Electronics. And all of this is before the most expensive part of many returns, the units that come back unsellable and get written off at cost.
Price the gap, fix the rate. Getting under your threshold removes the returns processing fee, but most of what returns cost you, the unrefunded fulfillment fee, the refund administration fee and unsellable units, keeps scaling with every single return.
What Is a Good Return Rate on Amazon?
A good Amazon return rate is any rate below your category's returns-fee threshold, measured per SKU over the three-month window: under 2.9% in Grocery, under 8.1% in Home and Kitchen, under 11.2% in Consumer Electronics. For apparel and shoes, which have no threshold, aim to sit clearly below comparable listings in your subcategory.
Across the 57 accounts I managed at Worldfront, the sellers who controlled returns did not chase a platform average. They knew three numbers per hero SKU: its threshold, its current three-month rate, and its top return reason. That is the whole system. A tiered target makes it practical:
| Where the SKU sits | Status | What to do this month |
|---|---|---|
| More than 2 points under its threshold | Healthy | Monitor monthly; protect the listing promises that keep it there |
| Within 2 points under the threshold | Watch | Pull return reasons; fix the top one before the next shipment cohort closes |
| Above the threshold | Paying the gap | Treat as a listing or product defect; re-price the SKU with return drag included |
| Apparel or shoes, above subcategory peers | Paying on every unit | Fit imagery, size guidance and fit language first; then re-check the margin |
How to Benchmark Your Own Return Rate by Category
Benchmark your own return rate by pulling Amazon's FBA customer returns data per SKU, rebuilding the three-month cohort rate, and comparing each SKU to its category threshold. Then check which returns Amazon should have reimbursed. Once it is set up, it is a monthly routine.
- 1Pull FBA customer returns and shipped units per SKU from Seller Central (the FBA returns pages and Return Insights dashboard, plus your shipment data).
- 2Rebuild each SKU's cohort rate: returns from month one through month three, divided by month-one shipped units.
- 3Tag each SKU with its category threshold from the table above, and flag anything within 2 points of it.
- 4Group return reasons for every flagged SKU; one dominant reason is usually a listing promise, not a product failure.
- 5Check for returns Amazon owes you for: refunds where the unit never came back, returns damaged in Amazon's facilities, and sellable returns never restocked.
- 6Re-run the cohort after the next shipment month closes, and record what you changed so you can see whether it worked.
Where SellerForge Fits (and Where It Doesn't)
Where it does not fit, plainly: SellerForge does not replace Amazon's own returns data. Your three-month cohort rates and return reasons come from Seller Central, and Amazon's Return Insights dashboard is free. SellerForge does not compute your per-SKU contribution margin today, so the return-drag math above still belongs in your profit tracker or spreadsheet. And if you only want claims filed for you without touching them, a commission-based reimbursement service is the simpler buy, even if it costs more over a year.
About the author
David Gallo is the founder of SellerForge.ai. Before building SellerForge, he managed 57 Amazon seller accounts representing more than $350M in sales at Worldfront, where the return problems that cost the most were never the fee itself but the listing promises that caused the returns.